I have a new article out now in the Journal of Planning Education and Research with Billy Riggs, in which we examine how two-way street conversions impact street network efficiency. Most of the efficiency literature looks at the benefits of one-way streets for signalization and vehicular throughput. We took a different approach, considering how one-way streets inherently increase travel distances.
Tag: planning
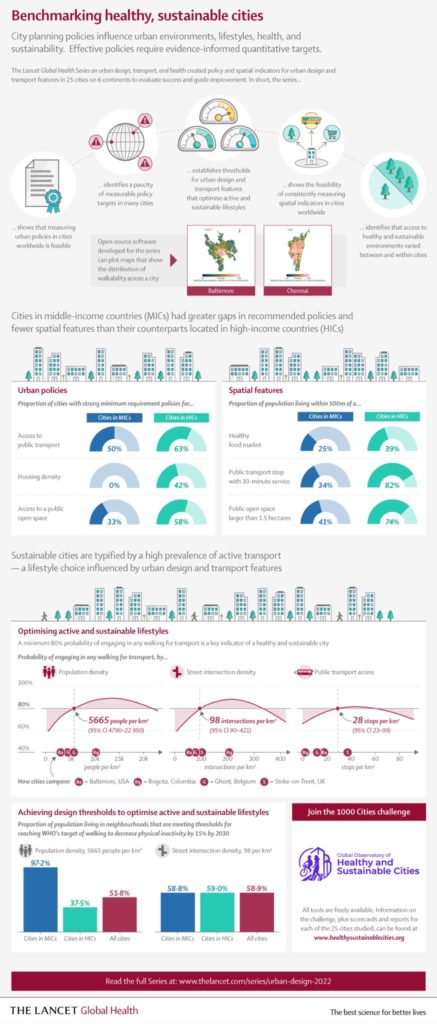
After many years of hard work, our series of articles on urban design, transport, and health has been published by The Lancet Global Health.
 In our first paper, we analyzed urban policies and calculated built environment indicators for 25 cities across 6 continents to assess walkability and accessibility. Our policy analysis found policies inconsistent with public health evidence, rhetoric endorsing health and sustainability but few measurable policy targets, and substantial implementation gaps.
Housing Tech and Tilted Platforms
I have a new article out now in a special issue on platform urbanism, co-authored with Max Besbris, David Wachsmuth, and Jake Wegmann, titled Tilted Platforms: Rental Housing Technology and the Rise of Urban Big Data Oligopolies. We reflect on short-term and long-term rental housing technologies and how they’re affecting the housing search, equity, and affordability.
From the abstract:
This article interprets emerging scholarship on rental housing platforms—particularly the most well-known and used short- and long-term rental housing platforms—and considers how the technological processes connecting both short-term and long-term rentals to the platform economy are transforming cities. It discusses potential policy approaches to more equitably distribute benefits and mitigate harms. We argue that information technology is not value-neutral. While rental housing platforms may empower data analysts and certain market participants, the same cannot be said for all users or society at large. First, user-generated online data frequently reproduce the systematic biases found in traditional sources of housing information. Evidence is growing that the information broadcasting potential of rental housing platforms may increase rather than mitigate sociospatial inequality. Second, technology platforms curate and shape information according to their creators’ own financial and political interests. The question of which data—and people—are hidden or marginalized on these platforms is just as important as the question of which data are available. Finally, important differences in benefits and drawbacks exist between short-term and long-term rental housing platforms, but are underexplored in the literature: this article unpacks these differences and proposes policy recommendations.
For more, check out the article.
I’m a co-author of a new article, “A Generalized Framework for Measuring Pedestrian Accessibility around the World Using Open Data,” which has just been published by Geographical Analysis. We developed an open source, containerized software framework for modeling pedestrian networks using open data to analyze disaggregate access to daily living needs. We worked with local partners in 25 cities around the world to demonstrate and validate this toolkit.
From the abstract:
Pedestrian accessibility is an important factor in urban transport and land use policy and critical for creating healthy, sustainable cities. Developing and evaluating indicators measuring inequalities in pedestrian accessibility can help planners and policymakers benchmark and monitor the progress of city planning interventions. However, measuring and assessing indicators of urban design and transport features at high resolution worldwide to enable city comparisons is challenging due to limited availability of official, high quality, and comparable spatial data, as well as spatial analysis tools offering customizable frameworks for indicator construction and analysis. To address these challenges, this study develops an open source software framework to construct pedestrian accessibility indicators for cities using open and consistent data. It presents a generalized method to consistently measure pedestrian accessibility at high resolution and spatially aggregated scale, to allow for both within- and between-city analyses. The open source and open data methods developed in this study can be extended to other cities worldwide to support local planning and policymaking. The software is made publicly available for reuse in an open repository.
For more, check out the article.
OSMnx v1.1 Released
OSMnx v1.1.0 has been released. It includes several new features, bug fixes, and performance enhancements. I encourage you to upgrade and take advantage of everything new. I’ll summarize some of the key improvements in this post.
My article, “Street Network Models and Indicators for Every Urban Area in the World” has been published by Geographical Analysis. This project was a massive undertaking and I’m excited to share it. As you might guess from the title, I modeled and analyzed the street network of each urban area in the world then deposited all the source code and models and indicators in open repositories for public reuse. The article also includes a high-level analysis of urban street network form across the world.
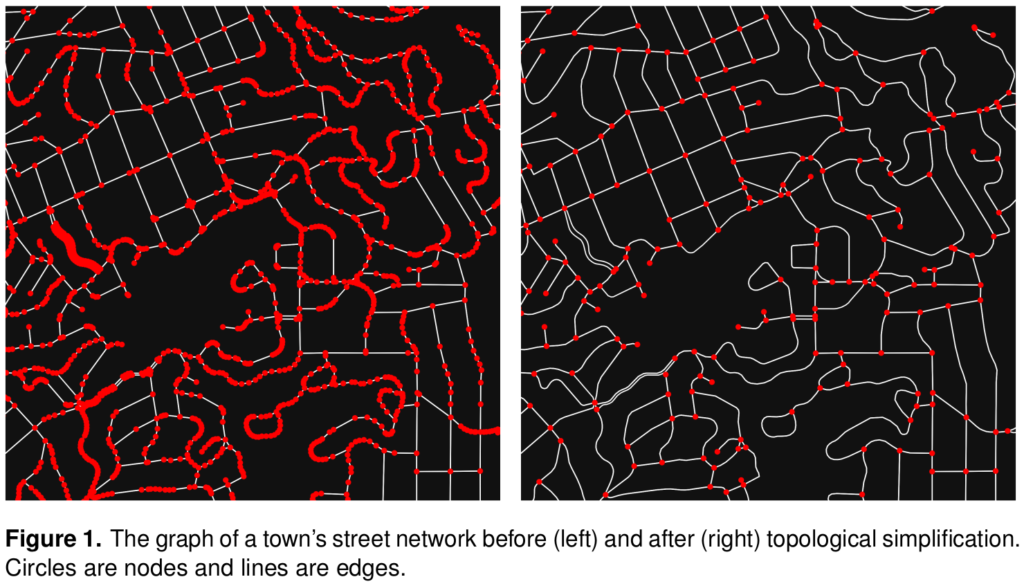
Cities worldwide exhibit a variety of street patterns and configurations that shape human mobility, equity, health, and livelihoods. Using boundaries derived from the Global Human Settlement Layer, I modeled and analyzed the street networks of every urban area in the world using OSMnx and OpenStreetMap raw data. In total, I modeled over 160 million street network nodes and over 320 million edges across 8,914 urban areas in 178 countries. I attached node elevations and street grades to every node/edge in the final models. All the final models were topologically simplified such that nodes represent intersections and dead-ends, and edges represent the street segments linking them.
OSMnx 1.0 Is Here
Happy new year! After five years of development and over 2,000 code commits from dozens of contributors, OSMnx v1.0 has officially been released. This has been a long labor of love and I’m thrilled to see it reach this milestone.
Much has changed in recent months with new features added and a few things deprecated. Most of this development occurred in a major overhaul over the summer, which I covered at the time in three previous posts. Among these dozens of enhancements were major speed and efficiency improvements throughout the package, better visualization, a new geometries module for retrieving any geospatial objects from OSM, topological intersection consolidation, and much more. I encourage you to read those posts to familiarize yourself with what’s new.
Urban Form and OpenStreetMap
My chapter “Exploring Urban Form Through OpenStreetMap Data: A Visual Introduction” has just been published in the new book Urban Experience and Design: Contemporary Perspectives on Improving the Public Realm edited by Justin Hollander and Ann Sussman.
From the abstract:
This chapter introduces OpenStreetMap—a crowdsourced, worldwide mapping project and geospatial data repository—to illustrate its usefulness in quickly and easily analyzing and visualizing planning and design outcomes in the built environment. It demonstrates the OSMnx toolkit for automatically downloading, modeling and visualizing spatial data from OpenStreetMap. We explore patterns and configurations in street networks and buildings around the world computationally through visualization methods—including figure-ground diagrams and polar histograms—that help compress urban complexity into comprehensible artifacts that reflect the human experience of the built environment. Ubiquitous urban data and computation can open up new urban form analyses from both quantitative and qualitative perspectives.
For more, check out the chapter.
Off the Grid… and Back Again?
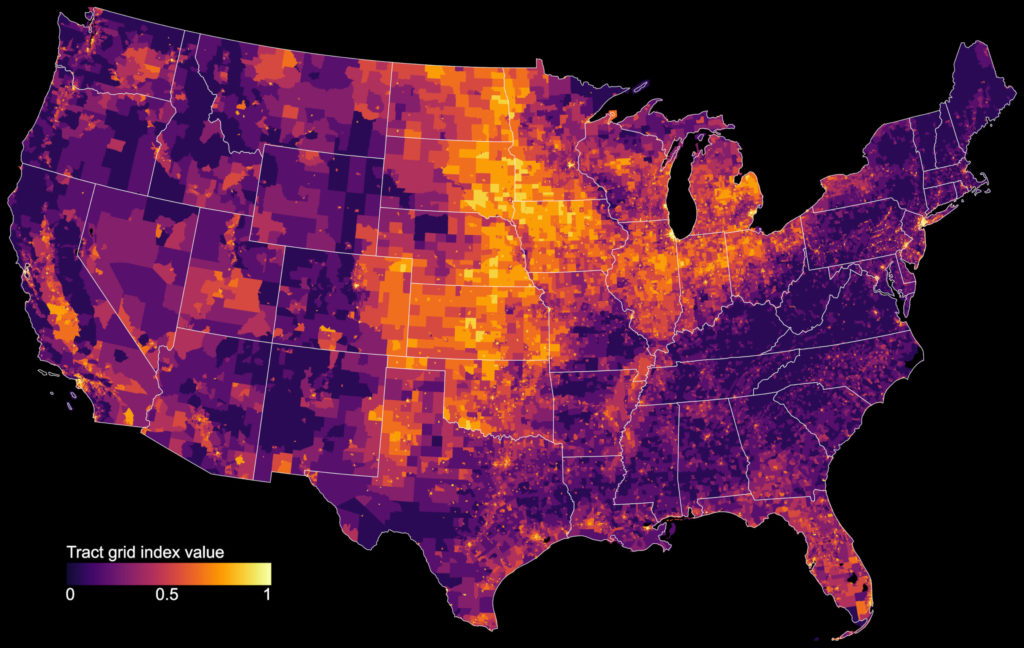
My article “Off the Grid… and Back Again? The Recent Evolution of American Street Network Planning and Design” has been published by the Journal of the American Planning Association and won the 2020 Stough-Johansson Springer Award for best paper. It identifies recent nationwide trends in American street network design, measuring how urban planners abandoned the grid and embraced sprawl over the 20th century, but since 2000 these trends have rebounded, shifting back toward historical design patterns. In this post I discuss these findings and visualizations across the US today as well as over time, then discuss my analysis methods.
What’s New With OSMnx, Part 2
This is a follow-up to last month’s post discussing the many new features, improvements, and optimizations made to OSMnx this summer. As this major improvement project now draws to a close, I will summarize what’s new(er) here. Long story short: there are a bunch of new features and everything in the package has been streamlined and optimized to be easier to use, faster, and more memory efficient.
First off, if you haven’t already, read the previous post about new features including topological intersection consolidation, automatic max speed imputation and travel time calculation, generalized points-of-interest queries, querying OSM by date, and API streamlining. This post covers new changes since then, including improved visualization and plotting, improved graph simplification, the new geocoder module, and other miscellaneous improvements.

