Worldwide Street Network Models and Indicators
My article, “Street Network Models and Indicators for Every Urban Area in the World” has been published by Geographical Analysis. This project was a massive undertaking and I’m excited to share it. As you might guess from the title, I modeled and analyzed the street network of each urban area in the world then deposited all the source code and models and indicators in open repositories for public reuse. The article also includes a high-level analysis of urban street network form across the world.
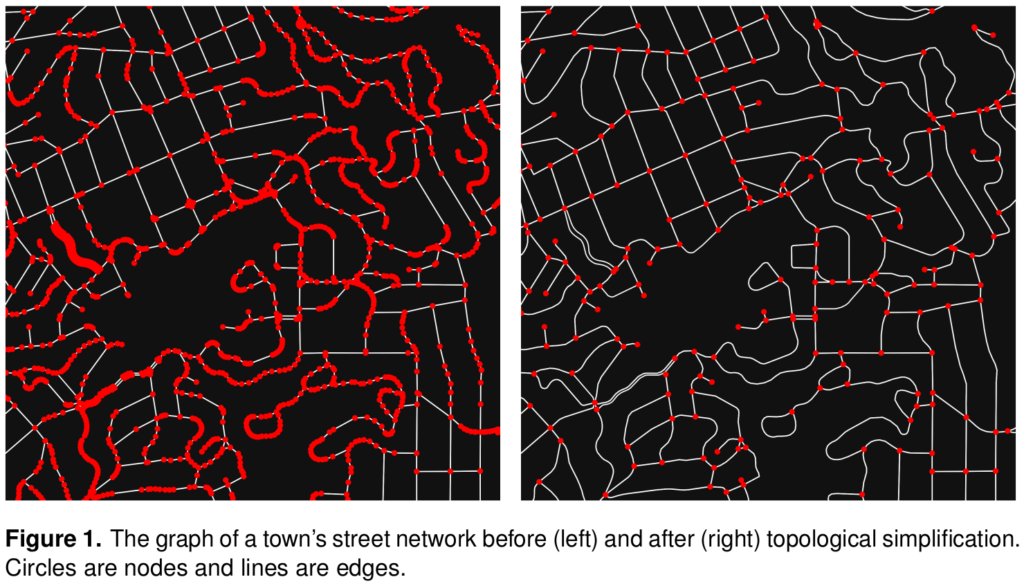
Cities worldwide exhibit a variety of street patterns and configurations that shape human mobility, equity, health, and livelihoods. Using boundaries derived from the Global Human Settlement Layer, I modeled and analyzed the street networks of every urban area in the world using OSMnx and OpenStreetMap raw data. In total, I modeled over 160 million street network nodes and over 320 million edges across 8,914 urban areas in 178 countries. I attached node elevations and street grades to every node/edge in the final models. All the final models were topologically simplified such that nodes represent intersections and dead-ends, and edges represent the street segments linking them.
I attached elevation data to each node from the SRTM and ASTER DEMs, and validated those values against the Google Maps Elevation API. Once all the nodes had elevations, I calculated each street’s grade (rise over run) in every urban area. Finally, I calculated several indicators of street network size, compactness, connectivity, circuity, clustering, hilliness, block lengths, orientation and entropy, and more. See details and findings in the article.
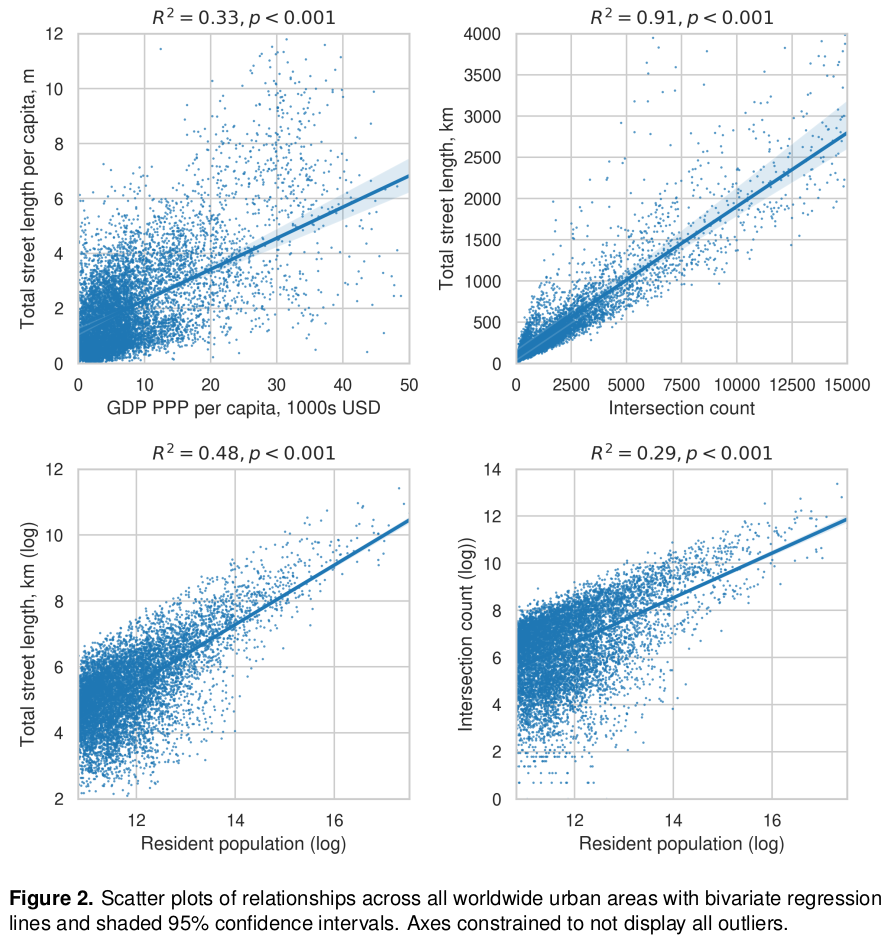
The article focuses on this open source pipeline for street network modeling and analysis, but it also includes a high-level analysis of urban street network form around the world. Total street length and intersection count both scale sub-linearly with population, which makes theoretical sense as more residents can share existing public infrastructure. Also, across all urban areas, the mean per capita street length is approx 2 meters, and a $10,000 increase in per capita GDP is associated with a 1 meter increase in per capita street length. This is an indicator of a city’s infrastructure accessibility: cities with greater wealth and economic activity tend to have more street infrastructure.
The elevation open data from ASTER and SRTM compare well with Google’s closed source, commercial data. All three sources’ elevation values correlate strongly (r > 0.999). The median pairwise difference between the nodes’ elevation values and the Google validation values is only 32 centimeters, and the median pairwise difference between the urban areas’ mean street network elevations and the GHSL mean elevations is only 16 centimeters.
All of this project’s Python source code and resulting models and indicators have been deposited in open repositories for public reuse. This represents the first such comprehensive repository of ready-to-use urban area street network models and indicators worldwide. For more details and findings, check out the article!