Off the Grid... and Back Again?
My article “Off the Grid… and Back Again? The Recent Evolution of American Street Network Planning and Design” has been published by the Journal of the American Planning Association and won the 2020 Stough-Johansson Springer best paper award.
It identifies recent nationwide trends in American street network design, measuring how urban planners abandoned the grid and embraced sprawl over the 20th century, but since 2000 these trends have rebounded, shifting back toward historical design patterns. In this post I discuss these findings and visualizations across the US today as well as over time, then discuss my analysis methods.
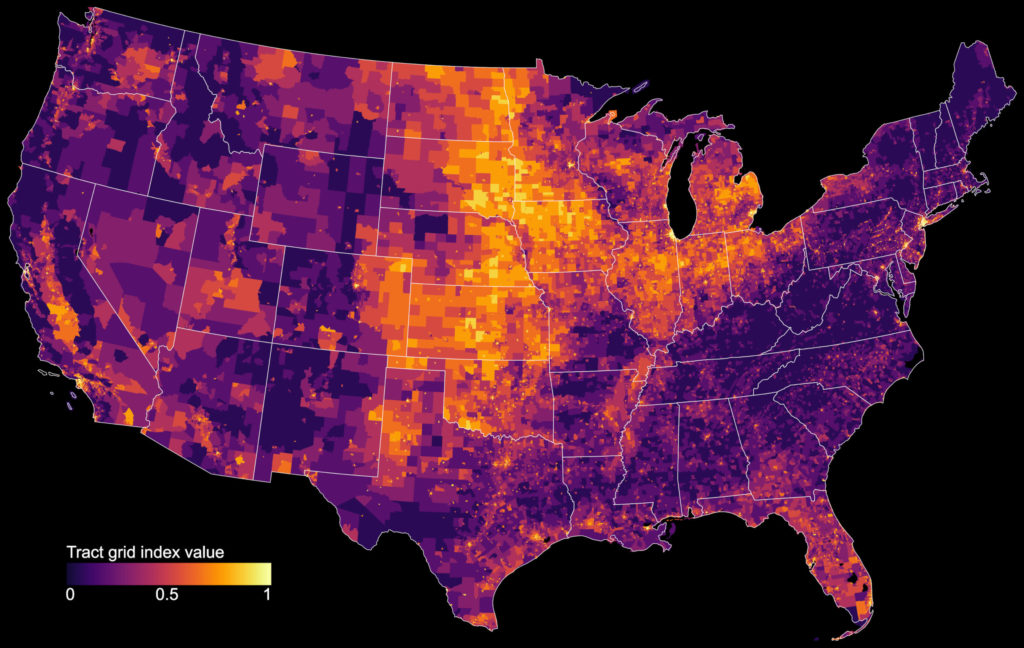
For starters, where do grid-like streets exist today? The figure above shows how grid-like each tract’s streets are today, across the contiguous US. We can see an archipelago of urban grids scattered across the country, as city centers tend to be more grid-like than suburbs or rural areas. Overall, the Great Plains and Midwest exhibit the most grid-like street networks on average, while New England and Appalachia exhibit the least so. During the 19th century, in the heyday of the gridded planning paradigm, rapid platting and subdivision occurred across vast swaths of relatively flat land in the Great Plains and Midwest. Today we can still see the influence of the US Homestead Act and similar historical planning instruments across this region: once built, street networks’ patterns remain a fairly permanent backbone.
Evolution of Street Design
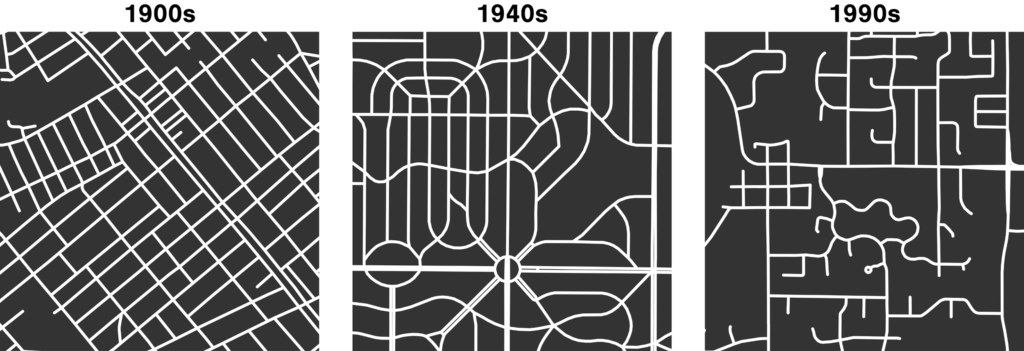
How has US street network design evolved over time? Given the semi-permanence of streets, we can examine snapshots of street patterns today to measure differences across places built in different eras. American street network design changed drastically over the 20th century. In the early 1900s, dense interconnected walkable imperfect grids were standard. But around the time of World War II, urbanization and planning shifted toward increasingly circuitous car-centric suburbs. By the 1990s, disconnected dendritic car-dependent sprawl dominated. Here are typical street patterns today in neighborhoods designed in different decades:
US street network design evolved over time toward car-dependent sprawl. To measure these street network design paradigms over time, I developed algorithms to estimate the vintage of each US census tract from a combination of census data, tax assessor data, and property transaction records (see article for full details). Then I grouped tracts by decade and looked at their average values today across a basket of street network indicators:
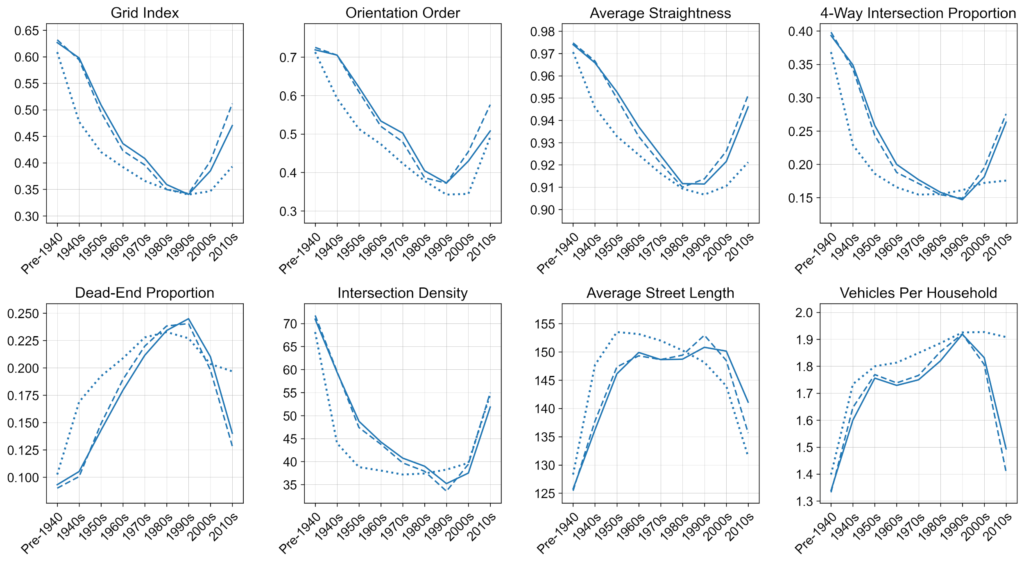
The figure above shows how these street network indicators trend together over time. Each trend line represents a different vintage estimation method, as robustness checks (see article for details). The indicator values track relatively well across all three estimation methods and their trends across decades tell the same story: street network griddedness, connectedness, density, and straightness declined steadily from their pre-war highs through the 1990s. Most interestingly, however, all of these variables’ trends have reversed over the past two decades.
Average griddedness is 84% higher in pre-1940 urban tracts than it is in 1990s-vintage urban tracts. Meanwhile, the average proportion of dead-ends is 163% higher in 1990s urban tracts than in pre-1940 urban tracts. Street networks also grew coarser-grained: the average intersection density in pre-1940 urban tracts is double that of 1990s urban tracts, while the 1990s’ average street segment length is 20% greater than pre-1940 (equivalent to a 25-meter increase in absolute terms). But since 2000, griddedness and related indicators have returned to levels not seen since the mid-20th century.
Controlling for covariates, I estimate a model of griddedness as a function of vintage. Each decade since 1940 is associated with lower griddedness than pre-1940. That is, tracts primarily built post-war may be larger, more spread- out, or hillier, but even when controlling for these characteristics, planners and engineers designed these street networks to be less grid-like than was typical prior to 1940. For instance, urban tracts primarily built in the 1980s or 1990s correspond to grid index values 0.15 points lower than those of pre- war tracts, all else equal.
This is important for making our cities less car-dependent. Today, households in 1990s-vintage urban tracts own approximately 50% more cars on average than those in pre-war tracts do. However, tract vintage correlates with other important factors like household size, income, and job proximity. Controlling for such covariates, I estimate a tract-level model of car ownership as a function of griddedness, with a full set of controls. All else equal, more grid-like places are associated with lower rates of car ownership, which itself has a well-established relationship with vehicle miles traveled. See the article for details.
The Takeaway
For over a century, American spatial planning relied on the orthogonal grid for geometric ordering. But urban planners and engineers reorganized cities around the logic of and demand for the automobile after World War II, shifting away from dense, interconnected, gridded street networks in a bid to simultaneously attenuate the automobile’s negative externalities (noise, pollution, streetscape blight, congestion, mortality) in residential communities while still empowering the populace to travel by car because it was fast and convenient. We can clearly see these design trends inscribed in the urban form of tracts of different vintage today. But, importantly, these trends have slowed or reversed since the year 2000, though not to pre-war levels.
Urban planning and public health scholars have identified significant relationships between vehicular emissions, road safety, active travel behavior, and street design variables like block lengths, intersection densities, and 4-way intersection proportions. Their research emphasizes the importance in planning practice of network connectivity and density for active travel, safety, and accessibility—yet planners, designers, engineers, and developers steadily drifted away from such connectivity and density as they abandoned the grid and embraced sprawl. Privileging driving over all other modes, 20th century planners locked-in generations of car dependence.
This study finds evidence of promising recent trends toward more sustainable urban forms. But the initial layout of streets and attendant land parcelization determine urban spatial structure for centuries, locking in mobility needs and capabilities for generations to come. Street network patterns are difficult to change once established. So what can we do today?
First, individual suburban retrofits can improve connectivity but are limited by the path dependence of infrastructure and land parcelization. Second, larger redevelopment projects offer strategic opportunities to incorporate (or restore) fine-grained connected networks into their design. Third, greenfield development may offer practitioners the most straightforward opportunity to continue the aggregate trend back toward more-connected patterns, but such projects are often disconnected from the rest of the urban fabric and far from job centers. Fourth, interconnected and relatively fine-grained grids already exist in the cores and inner-ring suburbs of most large US cities. Instead of building new grids on the urban fringe, planners can allow infill and densification to let more people live where the physical infrastructure already supports active transportation and freedom of mode choice.
Overall, planners and policymakers should review and revise codes and design guidelines at local, state, and federal levels to encourage and streamline the development of infrastructure that support broader sustainability and public health goals. Rather than merely reacting to fleeting mobility trends, it is imperative to plan proactively for street networks that can mitigate pervasive car dependence and allow freedom of mode choice.
Measuring Griddedness
Here’s a quick dive into my methods. I got tract boundaries from the US census bureau, then modeled and analyzed all the tracts’ street networks using Python, OSMnx, and OpenStreetMap data.
I mentioned a “grid index” earlier, which is an indicator I developed to measure street network griddedness. A street grid consists of a set of streets characterized by three properties: orientation order, straightness, and 4-way junctions. That is, to be a grid, a street network must have an internally- consistent orientation, be relatively straight, and primarily comprise 4-way intersections instead of three-way “T” junctions or dead-ends. Each of these components is necessary but alone insufficient for griddedness. Only in unison do they make a true grid.
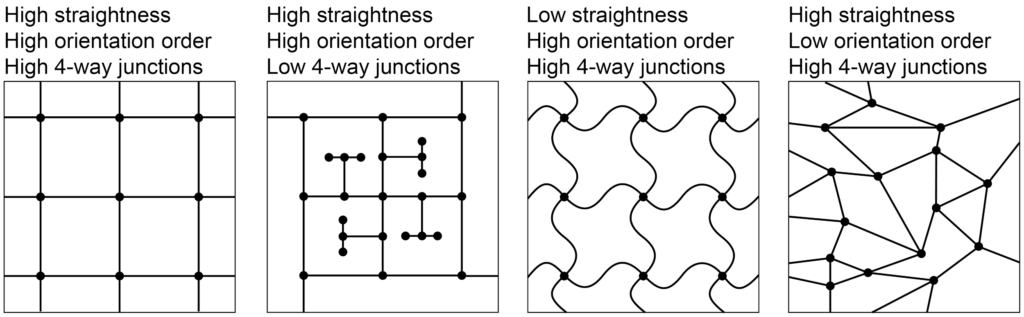
The grid index combines these three measures together. The notion of straightness or 4-way junctions is pretty straightforward. I’ve previously written about orientation order around the world, but the gist of it is: to what extent do a place’s streets all point in the same directions as each other?
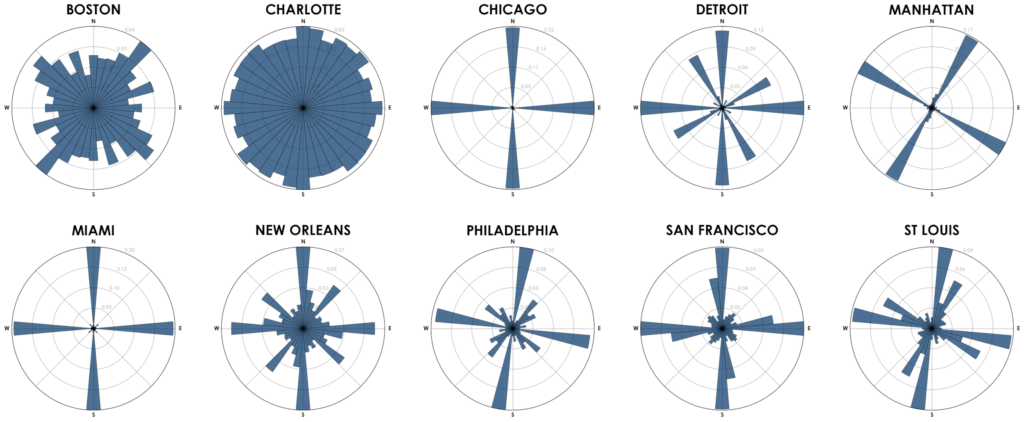
Above, the polar histogram bars’ directions represent compass bearings and bars’ lengths represent the proportion of city street segments with those bearings. For example, Chicago and Manhattan illustrate high orientation order: they have internally-consistent orientations as nearly all their streets point in just four different directions. In contrast, Charlotte and Boston illustrate low orientation order: their streets point more evenly in all directions. Further interpretation and worldwide findings on street orientation are here.
I also estimated each tract’s vintage algorithmically using three different methods, based on census bureau data and HISDAC-US property records and assessor data. These let us look at characteristics today of street network built in different decades. For more on my methods and findings, check out the article. And if you’d like to model and analyze street networks yourself, check out OSMnx.