<?xml version="1.0" encoding="utf-8"?><feed xmlns="http://www.w3.org/2005/Atom" ><generator uri="https://jekyllrb.com/" version="4.4.1">Jekyll</generator><link href="https://geoffboeing.com/feed/index.xml" rel="self" type="application/atom+xml" /><link href="https://geoffboeing.com/" rel="alternate" type="text/html" /><updated>2026-03-05T19:06:28+00:00</updated><id>https://geoffboeing.com/feed/index.xml</id><title type="html">Geoff Boeing</title><subtitle>Geoff Boeing is an Associate Professor in USC&apos;s Department of Urban Planning and Spatial Analysis.
</subtitle><author><name>Geoff Boeing</name></author><entry><title type="html">Travel Time Prediction from Sparse Open Data</title><link href="https://geoffboeing.com/2026/02/travel-time-prediction/" rel="alternate" type="text/html" title="Travel Time Prediction from Sparse Open Data" /><published>2026-02-14T21:54:00+00:00</published><updated>2026-02-14T21:54:00+00:00</updated><id>https://geoffboeing.com/2026/02/travel-time-prediction</id><content type="html" xml:base="https://geoffboeing.com/2026/02/travel-time-prediction/"><![CDATA[<p>My article “<a href="https://doi.org/10.1080/13658816.2026.2628193">Travel Time Prediction from Sparse Open Data</a>,” co-authored
by my doctoral student Wendy Zhou, has just been published in the
<em>International Journal of Geographical Information Science</em>. You can download
it from <a href="https://doi.org/10.1080/13658816.2026.2628193">IJGIS</a> or via this open-access <a href="https://doi.org/10.31235/osf.io/qepc6_v1">pre-print</a>.</p>

<p>This article tackles a longstanding problem in transport geography and planning:
how to estimate realistic driving travel times without access to proprietary
data, expensive APIs, or massive GPS trace datasets. Much of the planning
literature still relies on “naïve” methods (e.g., minimizing Euclidean distance,
network distance, or speed-limit-based traversal time) that systematically
under-predict real-world travel times. At the other extreme, state-of-the-art
models in computer science and transportation engineering can achieve really
good accuracy, but often require billions of observations, deep learning models,
and massive computational resources and capacity. We argue that planners and
applied researchers need a middle ground:</p>

<ul>
  <li>a method that uses free, open data</li>
  <li>runs on ordinary hardware</li>
  <li>and substantially improves accuracy over old naïve approaches</li>
</ul>

<p>Using Los Angeles as a case study, we combine OpenStreetMap data on street
networks, speed limits, traffic controls, and turns with a small training
sample of empirical travel times from the Google Routes API. We first compute
naïve shortest-path travel times, then train an interpretable random forest
model to predict travel time as a function of naïve time plus turn counts and
traffic controls encountered along each route. Whereas the naïve model
under-predicts travel time by over three minutes on average, our model’s
predictions differ from Google’s by just 0.34 seconds on average and achieve an
out-of-sample MAPE of 8.4%—comparable to far more data-intensive approaches.
Robustness checks with new network data yield similar performance, and SHAP
analysis supports the model’s theoretical soundness.</p>

<p>Our goal is not to replace state-of-the-art congested travel models, but to
equip less-resourced planners, scholars, and community advocates with a free,
open, and accurate tool for accessibility analysis, scenario planning, and
evidence-based interventions when resources are limited.</p>

<p>From the abstract:</p>

<blockquote>
  <p>Travel time prediction is central to transport geography and
planning’s accessibility analyses, sustainable transportation
infrastructure provision, and active transportation interventions.
However, calculating accurate travel times, especially for driving,
requires either extensive technical capacity and bespoke data, or
resources like the Google Maps API that quickly become prohibitively
expensive to analyze thousands or millions of trips necessary for
metropolitan-scale analyses. Such obstacles particularly challenge
less-resourced researchers, practitioners, and community advocates.
This article argues that a middle-ground is needed to provide
reasonably accurate travel time predictions without extensive data
or computing requirements. It introduces a free, open-source
minimally-congested driving time prediction model with minimal cost,
data, and computational requirements. It trains and tests this model
using the Los Angeles, California urban area as a case study by
calculating naïve travel times from open data then developing a
random forest model to predict travel times as a function of those
naïve times plus open data on turns and traffic controls. Validation
shows that this interpretable machine learning method offers a
superior middle-ground technique that balances reasonable accuracy
with minimal resource requirements.</p>
</blockquote>

<p>On a side note, my co-author and doctoral advisee Wendy Zhou was also awarded
the 2026 Tiebout Prize in Regional Science at the WRSA conference in Santa Fe
this week. Congrats Wendy!</p>

<p>For more, check out our article at <a href="https://doi.org/10.1080/13658816.2026.2628193">IJGIS</a> or via the open-access
<a href="https://doi.org/10.31235/osf.io/qepc6_v1">pre-print</a>.</p>

<!-- markdownlint-disable MD013 -->]]></content><author><name>Geoff Boeing</name></author><summary type="html"><![CDATA[My article “Travel Time Prediction from Sparse Open Data,” co-authored by my doctoral student Wendy Zhou, has just been published in the International Journal of Geographical Information Science. You can download it from IJGIS or via this open-access pre-print.]]></summary></entry><entry><title type="html">Nobel Sustainability Award</title><link href="https://geoffboeing.com/2025/11/nobel-sustainability-award/" rel="alternate" type="text/html" title="Nobel Sustainability Award" /><published>2025-11-15T00:14:51+00:00</published><updated>2025-11-15T00:14:51+00:00</updated><id>https://geoffboeing.com/2025/11/nobel-sustainability-award</id><content type="html" xml:base="https://geoffboeing.com/2025/11/nobel-sustainability-award/"><![CDATA[<p>The Nobel Sustainability Trust has announced that our team has won the 2025
<a href="https://www.nobelsustainabilitytrust.org/the-sustainability-award-2025">Nobel Sustainability Award</a> for “outstanding research and development for
intelligent and sustainable urban solutions” for our <a href="https://www.healthysustainablecities.org/">Global Observatory of
Healthy and Sustainable Cities</a> (GOHSC).</p>

<p>Urban sustainability is key to planetary health. Yet few cities have measurable
policy standards and targets to actually build healthier and more sustainable
cities, and their health-supportive built environment features are often
inadequate or inequitably distributed. Can residents sustainably access their
daily living needs? A critical step toward making cities healthier and more
sustainable is to empower policymakers and urban planners to consistently
measure neighborhood-level spatial indicators of the built environment.</p>

<p>At GOHSC, we measure spatial and policy indicators of healthy and sustainable
urban planning practice in partnership with a network of local collaborators in
cities around the world. Our analytics let non-technical users load and
transform their own local data to automatically calculate a set of indicators
and generate a report and scorecard infographic for advocacy work. Over the past
year, local planners, mayors’ offices, citizen advocates, and international
organizations have used this software to measure, benchmark, and monitor cities’
progress toward global health and sustainability goals. This supports
evidence-informed interventions anywhere from the neighborhood scale to the
metropolitan scale. Our software’s accessibility and rigor unlock the ability to
effect urgently needed change while reducing longstanding barriers to
participation, particularly in under-resourced cities and countries where better
planning for health and sustainability are most needed.</p>

<p>I’m really proud of this group. I’ve had the pleasure of serving on our
executive committee and as the spatial team co-lead since its inception. We’re
a member organization of the UN’s Global Urban Observatory Network and we
published a series of articles in <a href="/2022/06/lancet-series-transport-health/"><em>The Lancet Global Health</em></a> a couple years
ago about our work to date.</p>

<p>Sincere thanks to the hundreds of researchers and practitioners in hundreds of
cities around the world who have joined our collaboration network over the past
few years. And thank you to my colleagues on the executive committee: it is
truly a pleasure working with you.</p>

<!-- markdownlint-disable MD013 -->]]></content><author><name>Geoff Boeing</name></author><summary type="html"><![CDATA[The Nobel Sustainability Trust has announced that our team has won the 2025 Nobel Sustainability Award for “outstanding research and development for intelligent and sustainable urban solutions” for our Global Observatory of Healthy and Sustainable Cities (GOHSC).]]></summary></entry><entry><title type="html">AAG Session on Urban Spatial Analytics</title><link href="https://geoffboeing.com/2025/10/aag-urban-spatial-analytics/" rel="alternate" type="text/html" title="AAG Session on Urban Spatial Analytics" /><published>2025-10-14T18:00:01+00:00</published><updated>2025-10-14T18:00:01+00:00</updated><id>https://geoffboeing.com/2025/10/aag-urban-spatial-analytics</id><content type="html" xml:base="https://geoffboeing.com/2025/10/aag-urban-spatial-analytics/"><![CDATA[<p>AAG session call for papers: “Urban spatial analytics: Toward problem-driven
methods instead of methods-driven problems.”</p>

<p>I’m organizing a session with <a href="https://www.design.upenn.edu/people/elizabeth-delmelle">Elizabeth Delmelle</a> that asks: how can urban
data science and spatial analytics meaningfully address cities’ “wicked
problems” instead of just reaching for this year’s shiny new tool or the easy
data set we can just grab and analyze?</p>

<p>Cities today face challenges that feel intractable. Despite significant progress
in urban data science and spatial analytics over the past 20 years, the problems
tackled by this scholarship too often prioritize the “low-hanging fruit”
publication pipeline of letting easily available data and trendy methods
determine the research question rather than confronting urgent but arduous
challenges. Methods-driven research that gestures toward real-world applications
frequently features policy implications wholly detached from the political
constraints and implementation realities that practitioners must navigate.</p>

<p>We seek papers (theoretical, empirical, or viewpoint/commentary) that challenge
and critique this status quo. This is an opportunity to experiment, try new
things, attempt something hard that may not work, present null findings and
research failures – as long as you propose something ambitious to use spatial
methods to meaningfully improve urban living.</p>

<p>Submissions should use real-world problems to drive the methods (rather than
letting preferred methods determine the research problem) in urban data science
and spatial analytics. Example topics could include:</p>

<ul>
  <li>spatial data storytelling for societal change</li>
  <li>data visualization to foster urban political conversations in an era of
polarization</li>
  <li>evidence-based communication to persuade local stakeholders for the public
good</li>
  <li>changing people’s minds about a crisis with frozen battlelines, such as
climate change</li>
  <li>tangibly attenuating an urban wicked problem like homelessness or
unaffordability</li>
  <li>shifting negative public narratives around cities that run counter to
empirical evidence</li>
  <li>communicating the value of planning, funding, and infrastructure in an era of
budget crises and defunding</li>
  <li>lessening (rather than merely describing) inequity in deeply segregated and
unequal cities</li>
  <li>anything else that ambitiously tries to address a big problem facing cities
through the tools of urban data science and spatial analytics that has the
potential to produce meaningful and plausible change</li>
</ul>

<p><strong>Where/When</strong> : this session will be in-person at the American Association of
Geographers <a href="https://www.aag.org/events/aag2026/">Annual Meeting</a>, March 17-21, 2026, San Francisco, California.</p>

<p><strong>How to submit</strong> : submit your abstract to AAG by its Oct 30 deadline. Then
email your abstract and AAG PIN to both Geoff (boeing at usc dot edu) and
Elizabeth (delmelle at design dot upenn dot edu) by Nov 1 for us to consider for
the session. Session participants will be notified by Nov 20.</p>

<!-- markdownlint-disable MD013 -->]]></content><author><name>Geoff Boeing</name></author><summary type="html"><![CDATA[AAG session call for papers: “Urban spatial analytics: Toward problem-driven methods instead of methods-driven problems.”]]></summary></entry><entry><title type="html">A Universal Model of Urban Street Networks</title><link href="https://geoffboeing.com/2025/09/universal-model-street-networks/" rel="alternate" type="text/html" title="A Universal Model of Urban Street Networks" /><published>2025-09-29T19:35:31+00:00</published><updated>2025-09-29T19:35:31+00:00</updated><id>https://geoffboeing.com/2025/09/universal-model-street-networks</id><content type="html" xml:base="https://geoffboeing.com/2025/09/universal-model-street-networks/"><![CDATA[<p>Marc Barthelemy and I have a new article out in <em>Physical Review Letters</em> titled
“<a href="https://doi.org/10.1103/1vj4-n8vn">Universal Model of Urban Street Networks</a>” (because PRL apparently doesn’t
allow titles that start with an indefinite article).</p>

<p>We argue that a distinguishing feature of urban street networks, which makes
them unique compared to other spatial networks, is their extreme betweenness
centrality heterogeneity. In plain English that means that street networks are
particularly prone to chokepoints: network nodes on which a disproportionately
high number of shortest paths depend. Theoretically, we can explain this as a
street network that started as a backbone road, then grew and filled in as the
area around it urbanized.</p>

<p>
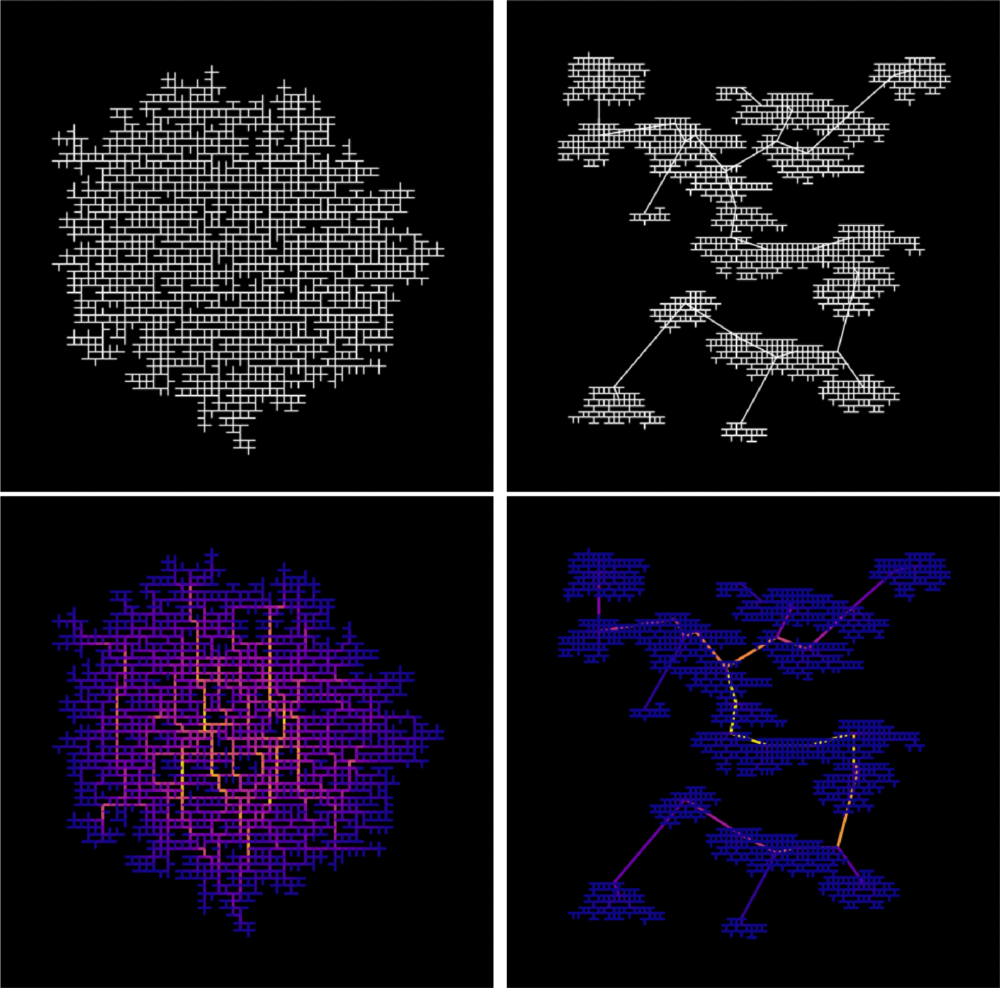
Building on this idea, we propose a generative model of urban street networks
- that is, a model that generates street networks that reproduce this
distinguishing feature. It turns out that most models don’t! Our proposed
model starts with a minimum spanning tree (the initial backbone) then adds
edges iteratively (the subsequent urbanization) to match empirical degree
distributions. Our model, implemented in Python, reproduces key empirical
characteristics well.</p>

<p><img src="/files/img/generative-network-models.png" alt="Two different networks with both having an equivalent density p=0.5 (N=4000).
On the left, we show a random Eden-like model, and below, the corresponding
distribution of the Gini coefficient. In this case the Gini coefficient of the
BC is G=0.51, and the spatial Gini is Gspa=0.26. On the right, we show the
result for our model based on the MST and the corresponding BC map. The BC Gini
is here equal to G=0.72, and the spatial Gini Gspa=0.40." /></p>

<p>From the abstract:</p>

<blockquote>
  <p>Analyzing 9000 urban areas’ street networks, we identify properties, including
extreme betweenness centrality heterogeneity, that typical spatial network
models fail to explain. Accordingly we propose a universal, parsimonious,
generative model based on a two-step mechanism that begins with a spanning
tree as a backbone then iteratively adds edges to match empirical degree
distributions. Controlled by a single parameter representing
lattice-equivalent node density, it accurately reproduces key universal
properties to bridge the gap between empirical observations and generative
models.</p>
</blockquote>

<p>For more, check out the <a href="https://doi.org/10.1103/1vj4-n8vn">article</a> at PRL or the open-access arXiv
<a href="https://arxiv.org/abs/2509.21931">pre-print</a>.</p>

<!-- markdownlint-disable MD013 -->]]></content><author><name>Geoff Boeing</name></author><summary type="html"><![CDATA[Marc Barthelemy and I have a new article out in Physical Review Letters titled “Universal Model of Urban Street Networks” (because PRL apparently doesn’t allow titles that start with an indefinite article).]]></summary></entry><entry><title type="html">Street Network Simplification</title><link href="https://geoffboeing.com/2025/06/street-network-simplification/" rel="alternate" type="text/html" title="Street Network Simplification" /><published>2025-06-13T16:15:44+00:00</published><updated>2025-06-13T16:15:44+00:00</updated><id>https://geoffboeing.com/2025/06/street-network-simplification</id><content type="html" xml:base="https://geoffboeing.com/2025/06/street-network-simplification/"><![CDATA[<p>How many street intersections do you see in this figure? I have a new article
published this week in <em>Transactions in GIS</em> (<a href="https://doi.org/10.1111/tgis.70037">open-access</a>) and its first
sentence sums it up: “Counting is hard.” Hear me out… it really is!</p>

<p><img src="/files/img/network-simplification-complex-intersections-1024x652.jpeg" alt="Street network graph simplification of complex intersections, nonplanarity,
and curve digitization from OpenStreetMap data" /></p>

<p>Most real-world objects belong to fuzzy categories, resulting in subjective
decisions about what to include or exclude from counts. Yet this complexity is
often obscured by a superficial impression that counting is easy to do because
its mechanics seem easy to understand. After all, everyone learns to count in
kindergarten by simply enumerating the elements in a set. But counting is <em>hard</em>
because defining that set and identifying its members are often nontrivial
tasks. Many of the world’s most important analytics rely far less on flashy data
science techniques than they do on counting things well and justifying those
counts effectively.</p>

<p>Street intersection counts and densities are ubiquitous measures in
transportation geography and planning. However, typical street network data and
typical street network analysis tools can substantially overcount them. This
article explains the 3 main reasons why this happens and presents solutions to
each.</p>

<p>Street intersections, particularly the complex kind common in modern car-
centric urban areas, are fuzzy objects for which most data sources do not
provide a simple 1:1 representation. This results in spatial uncertainty due to
data challenges in representing network nonplanarity, intersection complexity,
and curve digitization. Essentially all data sources suffer from at least 1 of
these problems due to difficulties representing divided roads, slip lanes,
roundabouts, interchanges, complex turning lanes, etc. If unaddressed, my
assessment shows that typical intersection counts (and downstream densities)
would be overestimated by &gt;14%, but very unevenly so in different parts of the
world. This bias’s extreme heterogeneity particularly hinders comparative urban
analytics.</p>

<p><img src="/files/img/osmnx-network-simplification-1024x586.png" alt="Street network topology simplification with OSMnx and OpenStreetMap" /></p>

<p>Mitigating these 3 problems is a project I’ve been iteratively refining for the
past decade. It was a central focus of my dissertation and a key motivation for
originally developing <a href="/2025/05/osmnx-reference-paper/">OSMnx</a>. This article presents OSMnx’s algorithms to
automatically simplify spatial graphs of urban street networks—via edge
simplification and node consolidation—resulting in faster parsimonious models
and more accurate network measures like intersection counts and densities,
street segment lengths, and node degrees. These algorithms’ information
compression drastically improves downstream graph analytics’ memory and runtime
efficiency, boosting analytical tractability without loss of model fidelity.</p>

<p>Counting is hard, but we can make it a little easier by using better models. For
more, check out the <a href="https://doi.org/10.1111/tgis.70037">open-access article</a>.</p>

<!-- markdownlint-disable MD013 -->]]></content><author><name>Geoff Boeing</name></author><summary type="html"><![CDATA[How many street intersections do you see in this figure? I have a new article published this week in Transactions in GIS (open-access) and its first sentence sums it up: “Counting is hard.” Hear me out… it really is!]]></summary></entry><entry><title type="html">OSMnx Reference Paper Published</title><link href="https://geoffboeing.com/2025/05/osmnx-reference-paper/" rel="alternate" type="text/html" title="OSMnx Reference Paper Published" /><published>2025-05-05T23:27:14+00:00</published><updated>2025-05-05T23:27:14+00:00</updated><id>https://geoffboeing.com/2025/05/osmnx-reference-paper</id><content type="html" xml:base="https://geoffboeing.com/2025/05/osmnx-reference-paper/"><![CDATA[<p>The official OSMnx reference paper, titled “<a href="https://doi.org/10.1111/gean.70009">Modeling and Analyzing Urban
Networks and Amenities With OSMnx</a>,” has just been published open-access by
<em>Geographical Analysis</em>. Years in the making, this article describes what OSMnx
does and why it does it that way.</p>

<p><img src="/files/img/square-mile-street-networks-1024x822.jpg" alt="OSMnx: Figure-ground diagrams of one square mile of each street network, from
OpenStreetMap, made in Python with matplotlib, geopandas, and NetworkX" /></p>

<p>But wait, there’s more! I also discuss many lessons learned over the past decade
in geospatial software development, including:</p>

<ul>
  <li>what makes a good API, and why is it so hard for academics to make one</li>
  <li>how your development pipeline and continuous integration can make or break
your quality of life as an open-source developer</li>
  <li>dependency ecosystems and the fine line between dependency heaven and
dependency hell</li>
  <li>why reusable geospatial software is so important for open science, and how we
can advance it</li>
</ul>

<p>All of these lessons have become central to the work my RAs do in the Urban Data
Lab at USC. They’re not always easy, but they make a clear improvement in code
quality, clarity, and reusability that directly impacts our downstream empirical
analyses and scientific theorizing.</p>

<p>From the abstract:</p>

<blockquote>
  <p>OSMnx is a Python package for downloading, modeling, analyzing, and
visualizing urban networks and any other geospatial features from
OpenStreetMap data. A large and growing body of literature uses it to conduct
scientific studies across the disciplines of geography, urban planning,
transport engineering, computer science, and others. The OSMnx project has
recently developed and implemented many new features, modeling capabilities,
and analytical methods. The package now encompasses substantially more
functionality than was previously documented in the literature. This article
introduces OSMnx’s modern capabilities, usage, and design—in addition to the
scientific theory and logic underlying them. It shares lessons learned in
geospatial software development and reflects on open science’s implications
for urban modeling and analysis.</p>
</blockquote>

<p>This year will mark the 10th anniversary of my work on the OSMnx project. It
recently reached <a href="/2024/12/osmnx-v2-released/">version 2.0</a> with a slew of new features and enhancements.
If you haven’t used it before, OSMnx is a Python package to easily download,
model, analyze, and visualize street networks and any other geospatial features
from OpenStreetMap. You can download and model walking, driving, or biking
networks with a single line of code then quickly analyze and visualize them. You
can just as easily work with urban amenities/points of interest, building
footprints, transit stops, elevation data, street orientations, speed/travel
time, and routing.</p>

<p>For more, check out <a href="https://doi.org/10.1111/gean.70009">the article</a> at <em>Geographical Analysis</em>.</p>

<!-- markdownlint-disable MD013 -->]]></content><author><name>Geoff Boeing</name></author><summary type="html"><![CDATA[The official OSMnx reference paper, titled “Modeling and Analyzing Urban Networks and Amenities With OSMnx,” has just been published open-access by Geographical Analysis. Years in the making, this article describes what OSMnx does and why it does it that way.]]></summary></entry><entry><title type="html">Tenure</title><link href="https://geoffboeing.com/2025/04/tenure/" rel="alternate" type="text/html" title="Tenure" /><published>2025-04-30T10:17:58+00:00</published><updated>2025-04-30T10:17:58+00:00</updated><id>https://geoffboeing.com/2025/04/tenure</id><content type="html" xml:base="https://geoffboeing.com/2025/04/tenure/"><![CDATA[<p>This is just a brief personal announcement that USC has decided to grant me
tenure and promote me to Associate Professor. This has been a long and arduous
journey, but I wouldn’t have it any other way. There hasn’t been much to
celebrate this year in academia or science or international collaboration—the
worlds in which I live my daily life—but here’s a small thing to celebrate.</p>

<p>Thank you to everyone who supported me along the way.</p>]]></content><author><name>Geoff Boeing</name></author><summary type="html"><![CDATA[This is just a brief personal announcement that USC has decided to grant me tenure and promote me to Associate Professor. This has been a long and arduous journey, but I wouldn’t have it any other way. There hasn’t been much to celebrate this year in academia or science or international collaboration—the worlds in which I live my daily life—but here’s a small thing to celebrate.]]></summary></entry><entry><title type="html">Zephyr Foundation Award</title><link href="https://geoffboeing.com/2025/03/zephyr-foundation-award/" rel="alternate" type="text/html" title="Zephyr Foundation Award" /><published>2025-03-01T13:09:25+00:00</published><updated>2025-03-01T13:09:25+00:00</updated><id>https://geoffboeing.com/2025/03/zephyr-foundation-award</id><content type="html" xml:base="https://geoffboeing.com/2025/03/zephyr-foundation-award/"><![CDATA[<p>I am happy to share that I was awarded the Zephyr Foundation’s 2025
<a href="https://zephyrtransport.org/technical-achievement-award/">Exceptional Technical Achievement Award</a> for my work on OSMnx. This annual
award recognizes a project that has had a positive impact on the fields or
transportation and/or land use decision-making.</p>

<p>This year will mark the 10th anniversary of my work on the OSMnx project. It
recently reached <a href="/2024/12/osmnx-v2-released/">version 2.0</a> with a slew of new features and enhancements.
If you haven’t used it before, OSMnx is a Python package to easily download,
model, analyze, and visualize street networks and any other geospatial features
from OpenStreetMap. You can download and model walking, driving, or biking
networks with a single line of code then quickly analyze and visualize them. You
can just as easily work with urban amenities/points of interest, building
footprints, transit stops, elevation data, street orientations, speed/travel
time, and routing.</p>

<p>If you’re interested in this tool, you can <a href="https://osmnx.readthedocs.io/">read more about it here</a>.</p>

<!-- markdownlint-disable MD013 -->]]></content><author><name>Geoff Boeing</name></author><summary type="html"><![CDATA[I am happy to share that I was awarded the Zephyr Foundation’s 2025 Exceptional Technical Achievement Award for my work on OSMnx. This annual award recognizes a project that has had a positive impact on the fields or transportation and/or land use decision-making.]]></summary></entry><entry><title type="html">Global Healthy and Sustainable City Indicators</title><link href="https://geoffboeing.com/2025/02/global-healthy-sustainable-city-indicators/" rel="alternate" type="text/html" title="Global Healthy and Sustainable City Indicators" /><published>2025-02-18T18:08:53+00:00</published><updated>2025-02-18T18:08:53+00:00</updated><id>https://geoffboeing.com/2025/02/global-healthy-sustainable-city-indicators</id><content type="html" xml:base="https://geoffboeing.com/2025/02/global-healthy-sustainable-city-indicators/"><![CDATA[<p>I recently co-authored an <a href="https://doi.org/10.1177/23998083241292102">article</a>, “Global Healthy and Sustainable City
Indicators: Collaborative Development of an Open Science Toolkit for Calculating
and Reporting on Urban Indicators Internationally,” now published in
<em>Environment and Planning B: Urban Analytics and City Science</em>. This was a
collaboration with my colleagues at the Global Observatory of Healthy and
Sustainable Cities, in which we discuss our spatial software co-development
process with collaborators and practitioners around the world.</p>

<p>From the abstract:</p>

<blockquote>
  <p>Measuring and monitoring progress towards achieving healthy, equitable and
sustainable cities is a priority for planners, policymakers and researchers in
diverse contexts globally. Yet data collection, analysis, visualisation and
reporting on policy and spatial indicators involve specialised knowledge,
skills, and collaboration across disciplines. Integrated open-source tools
for calculating and communicating urban indicators for diverse urban contexts
are needed, which provide the multiple streams of evidence required to
influence policy agendas and enable local changes towards healthier and more
sustainable cities. This paper reports on the development of open-source
software for planning, analysis and generation of data, maps and reports on
policy and spatial indicators of urban design and transport features for
healthy and sustainable cities. We engaged a collaborative network of
researchers and practitioners from diverse geographic contexts through an
online survey and workshops, to understand and progressively meet their
requirements for policy and spatial indicators. We outline our framework for
action research-informed open-source software development and discuss benefits
and challenges of this approach. The resulting Global Healthy and Sustainable
City Indicators software is designed to meet the needs of researchers,
planners, policy makers and community advocates in diverse settings for
planning, calculating and disseminating policy and spatial urban indicators.</p>
</blockquote>

<p>For more, check out the <a href="https://doi.org/10.1177/23998083241292102">article</a>.</p>

<!-- markdownlint-disable MD013 -->]]></content><author><name>Geoff Boeing</name></author><summary type="html"><![CDATA[I recently co-authored an article, “Global Healthy and Sustainable City Indicators: Collaborative Development of an Open Science Toolkit for Calculating and Reporting on Urban Indicators Internationally,” now published in Environment and Planning B: Urban Analytics and City Science. This was a collaboration with my colleagues at the Global Observatory of Healthy and Sustainable Cities, in which we discuss our spatial software co-development process with collaborators and practitioners around the world.]]></summary></entry><entry><title type="html">Surfacic Networks</title><link href="https://geoffboeing.com/2025/01/surfacic-networks/" rel="alternate" type="text/html" title="Surfacic Networks" /><published>2025-01-31T01:51:19+00:00</published><updated>2025-01-31T01:51:19+00:00</updated><id>https://geoffboeing.com/2025/01/surfacic-networks</id><content type="html" xml:base="https://geoffboeing.com/2025/01/surfacic-networks/"><![CDATA[<p>I recently coauthored an <a href="https://doi.org/10.1093/pnasnexus/pgae585">article</a> titled “Surfacic Networks” in <em>PNAS Nexus</em>
with Marc Barthelemy, Alain Chiaradia, and Chris Webster. We propose the concept
of surfacic networks to describe a class of spatial networks embedded in
non-flat two-dimensional manifolds (e.g., the Earth’s surface), and what this
means for distance metrics and lazy path solving when accounting for
fluctuations in the manifold’s curvature (e.g., changes in elevation on Earth’s
surface).</p>

<p><img src="/files/img/surfacic-network.jpeg" alt="Surfacic network: a spatial network embedded in a non-flat two-dimensional
manifold such as the Earth's surface accounting for elevation changes" /></p>

<p>From the abstract:</p>

<blockquote>
  <p>Surfacic networks are structures built upon a 2D manifold. Many systems,
including transportation networks and various urban networks, fall into this
category. The fluctuations of node elevations imply significant deviations
from typical plane networks and require specific tools to understand their
impact. Here, we present such tools, including lazy paths that minimize
elevation differences, graph arduousness which measures the tiring nature of
shortest paths (SPs), and the excess effort, which characterizes positive
elevation variations along SPs. We illustrate these measures using toy models
of surfacic networks and empirically examine pedestrian networks in selected
cities. Specifically, we examine how changes in elevation affect the spatial
distribution of betweenness centrality. We also demonstrate that the excess
effort follows a nontrivial power law distribution, with an exponent that is
not universal, which illustrates that there is a significant probability of
encountering steep slopes along SPs, regardless of the elevation difference
between the starting point and the destination. These findings highlight the
significance of elevation fluctuations in shaping network characteristics.
Surfacic networks offer a promising framework for comprehensively analyzing
and modeling complex systems that are situated on or constrained to a surface
environment.</p>
</blockquote>

<p>For more, check out the <a href="https://doi.org/10.1093/pnasnexus/pgae585">article</a>.</p>

<!-- markdownlint-disable MD013 -->]]></content><author><name>Geoff Boeing</name></author><summary type="html"><![CDATA[I recently coauthored an article titled “Surfacic Networks” in PNAS Nexus with Marc Barthelemy, Alain Chiaradia, and Chris Webster. We propose the concept of surfacic networks to describe a class of spatial networks embedded in non-flat two-dimensional manifolds (e.g., the Earth’s surface), and what this means for distance metrics and lazy path solving when accounting for fluctuations in the manifold’s curvature (e.g., changes in elevation on Earth’s surface).]]></summary></entry></feed>