Categories
Data

OSMnx Reference Paper Published

The official OSMnx reference paper, titled “Modeling and Analyzing Urban Networks and Amenities With OSMnx,” has just been published open-access by Geographical Analysis. Years in the making, this article describes what OSMnx does and why it does it that way.

OSMnx: Figure-ground diagrams of one square mile of each street network, from OpenStreetMap, made in Python with matplotlib, geopandas, and NetworkXBut wait, there’s more! I also discuss many lessons learned over the past decade in geospatial software development, including:

  • what makes a good API, and why is it so hard for academics to make one
  • how your development pipeline and continuous integration can make or break your quality of life as an open-source developer
  • dependency ecosystems and the fine line between dependency heaven and dependency hell
  • why reusable geospatial software is so important for open science, and how we can advance it

All of these lessons have become central to the work my RAs do in the Urban Analytics lab at USC. They’re not always easy, but they make a clear improvement in code quality, clarity, and reusability that directly impacts our downstream empirical analyses and scientific theorizing.

From the abstract:

OSMnx is a Python package for downloading, modeling, analyzing, and visualizing urban networks and any other geospatial features from OpenStreetMap data. A large and growing body of literature uses it to conduct scientific studies across the disciplines of geography, urban planning, transport engineering, computer science, and others. The OSMnx project has recently developed and implemented many new features, modeling capabilities, and analytical methods. The package now encompasses substantially more functionality than was previously documented in the literature. This article introduces OSMnx’s modern capabilities, usage, and design—in addition to the scientific theory and logic underlying them. It shares lessons learned in geospatial software development and reflects on open science’s implications for urban modeling and analysis.

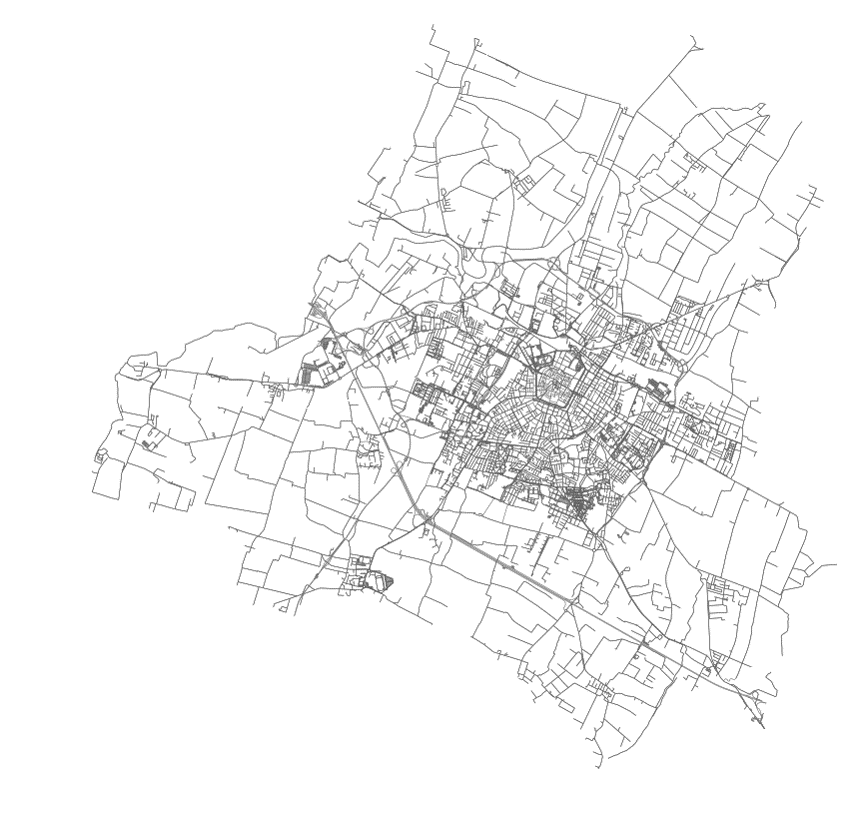
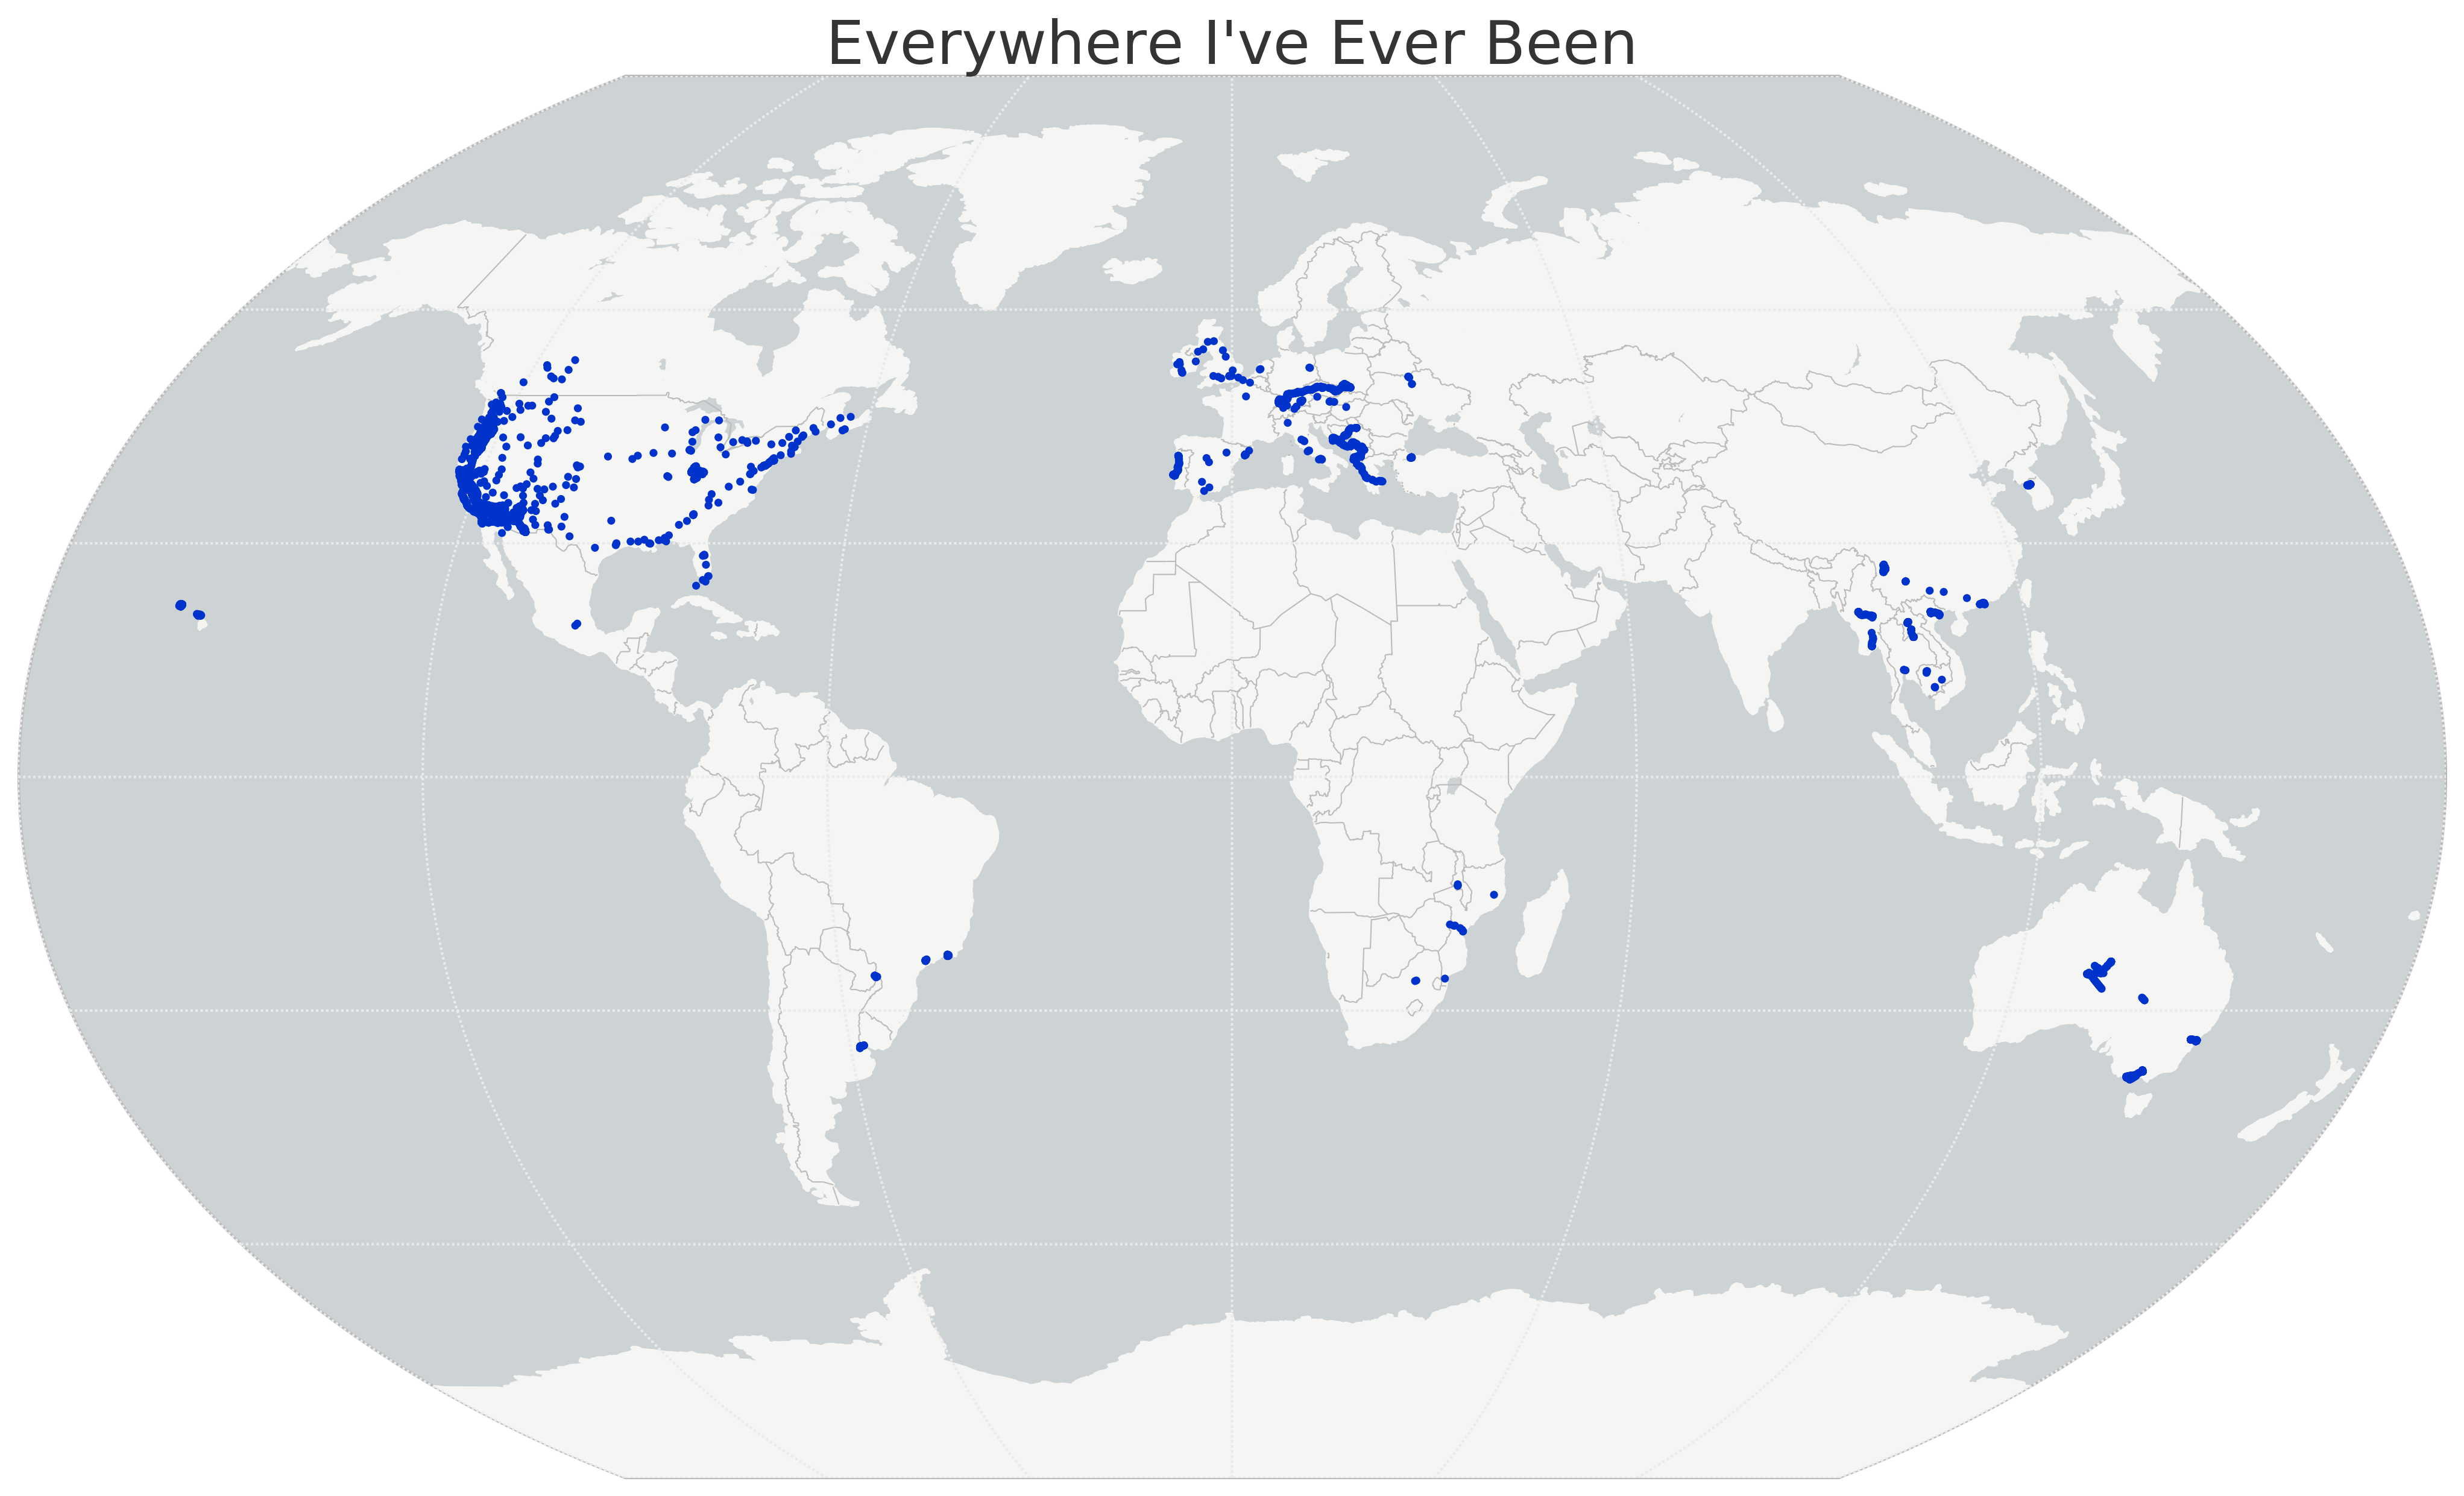
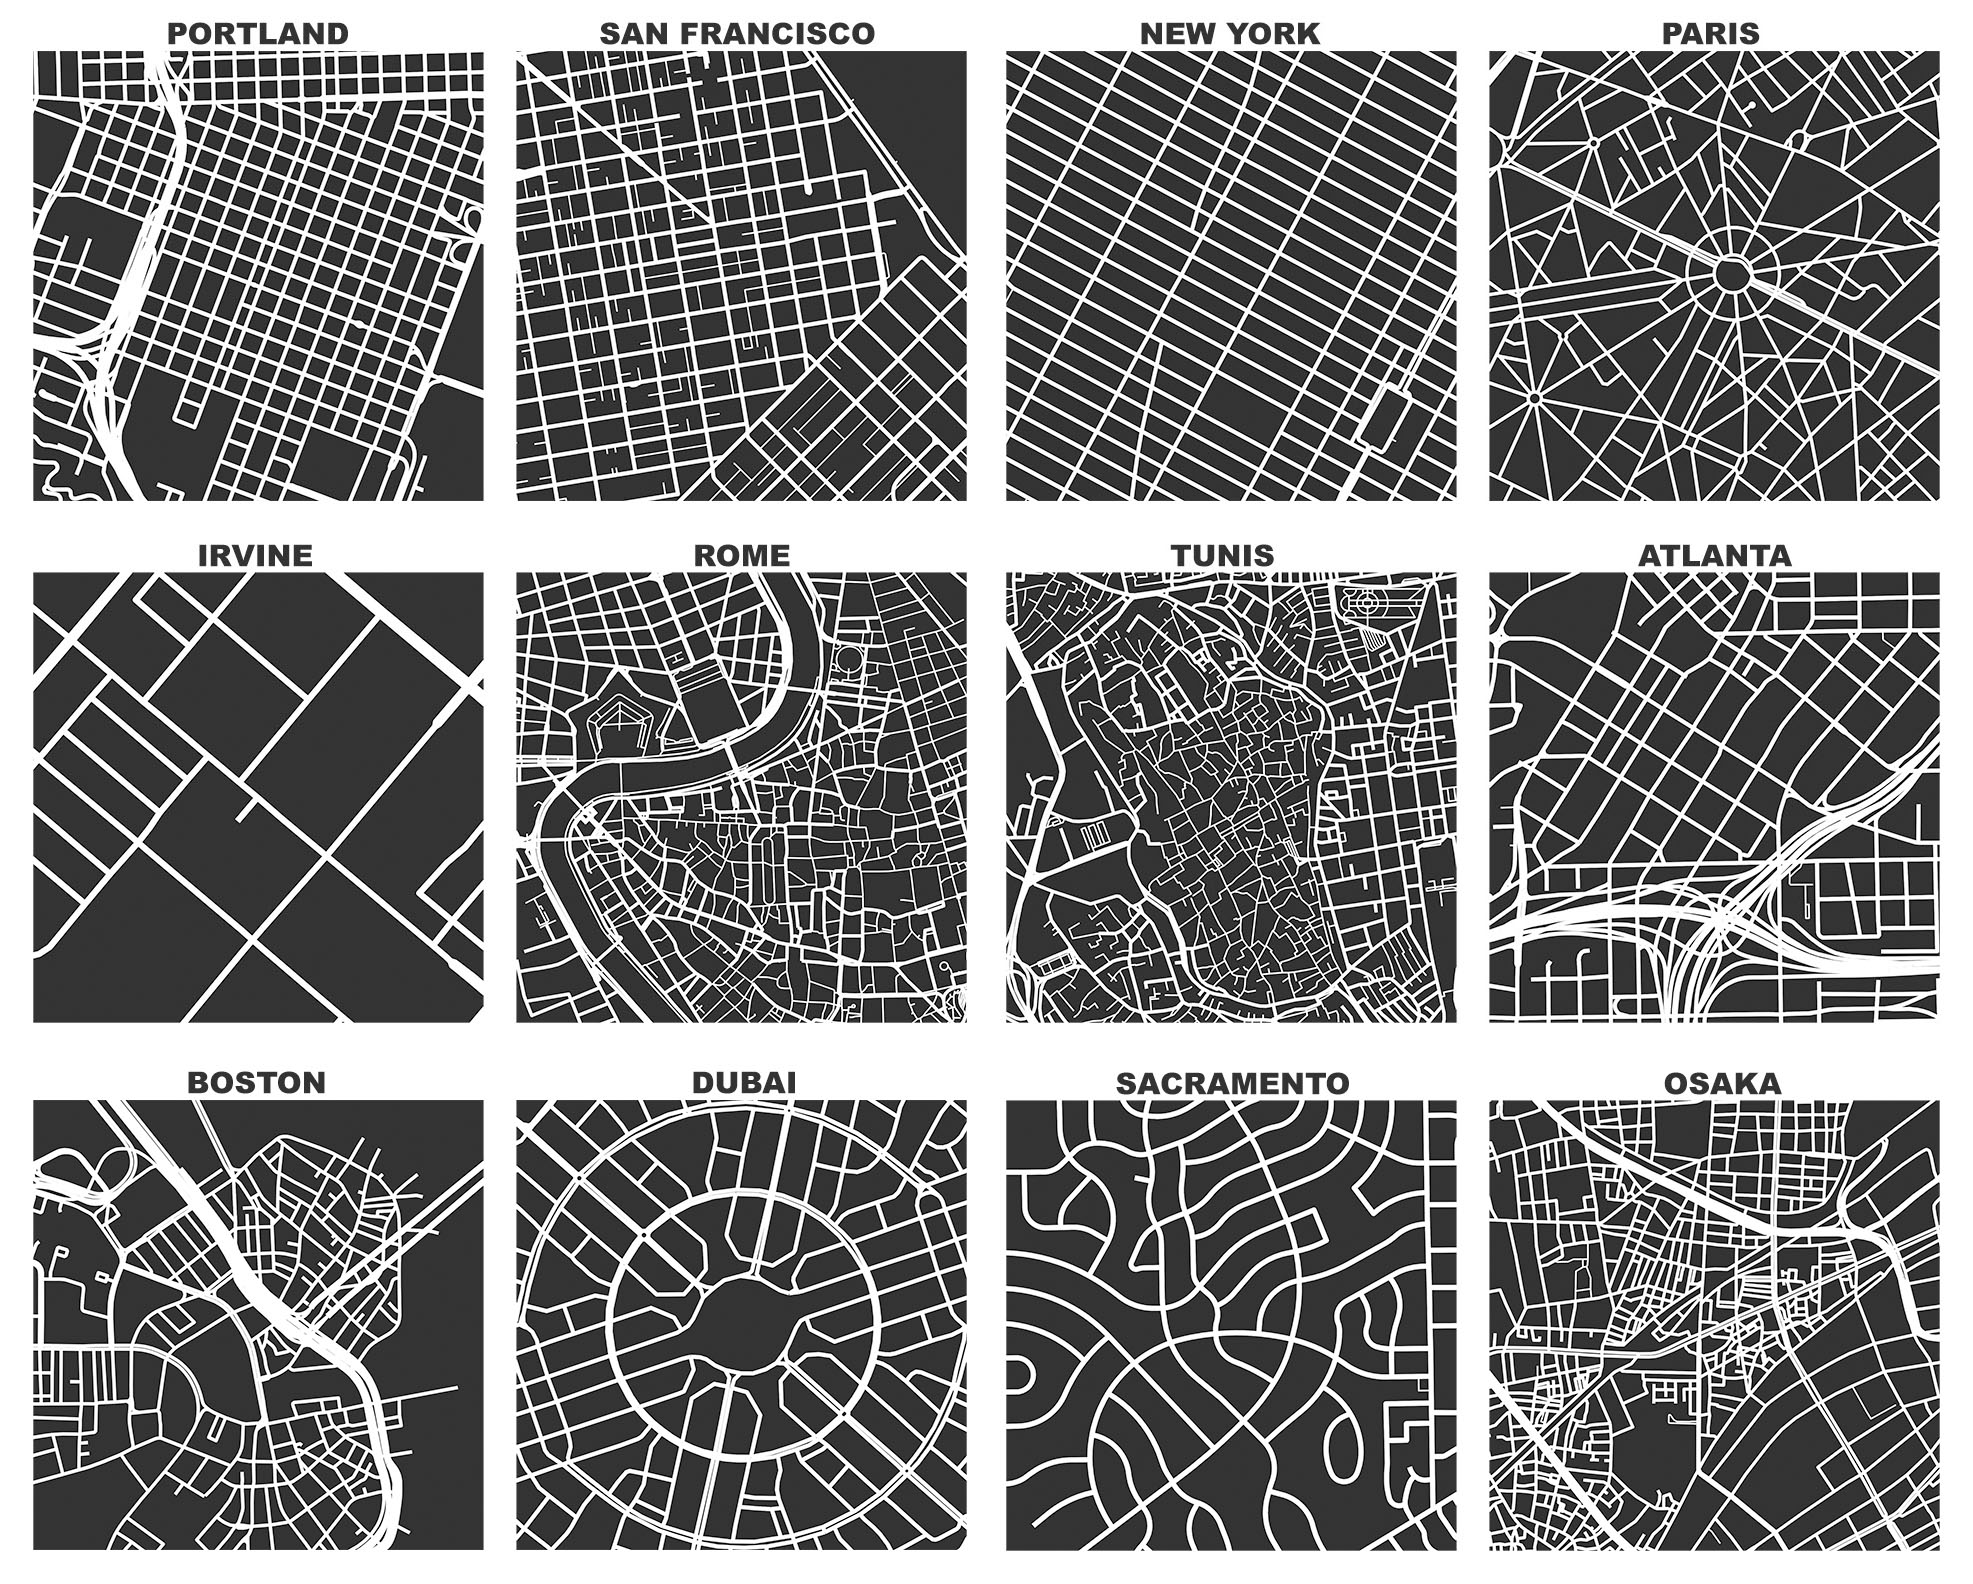
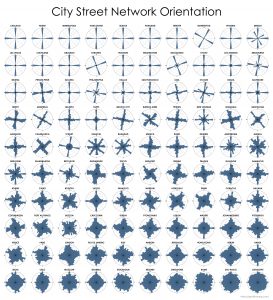
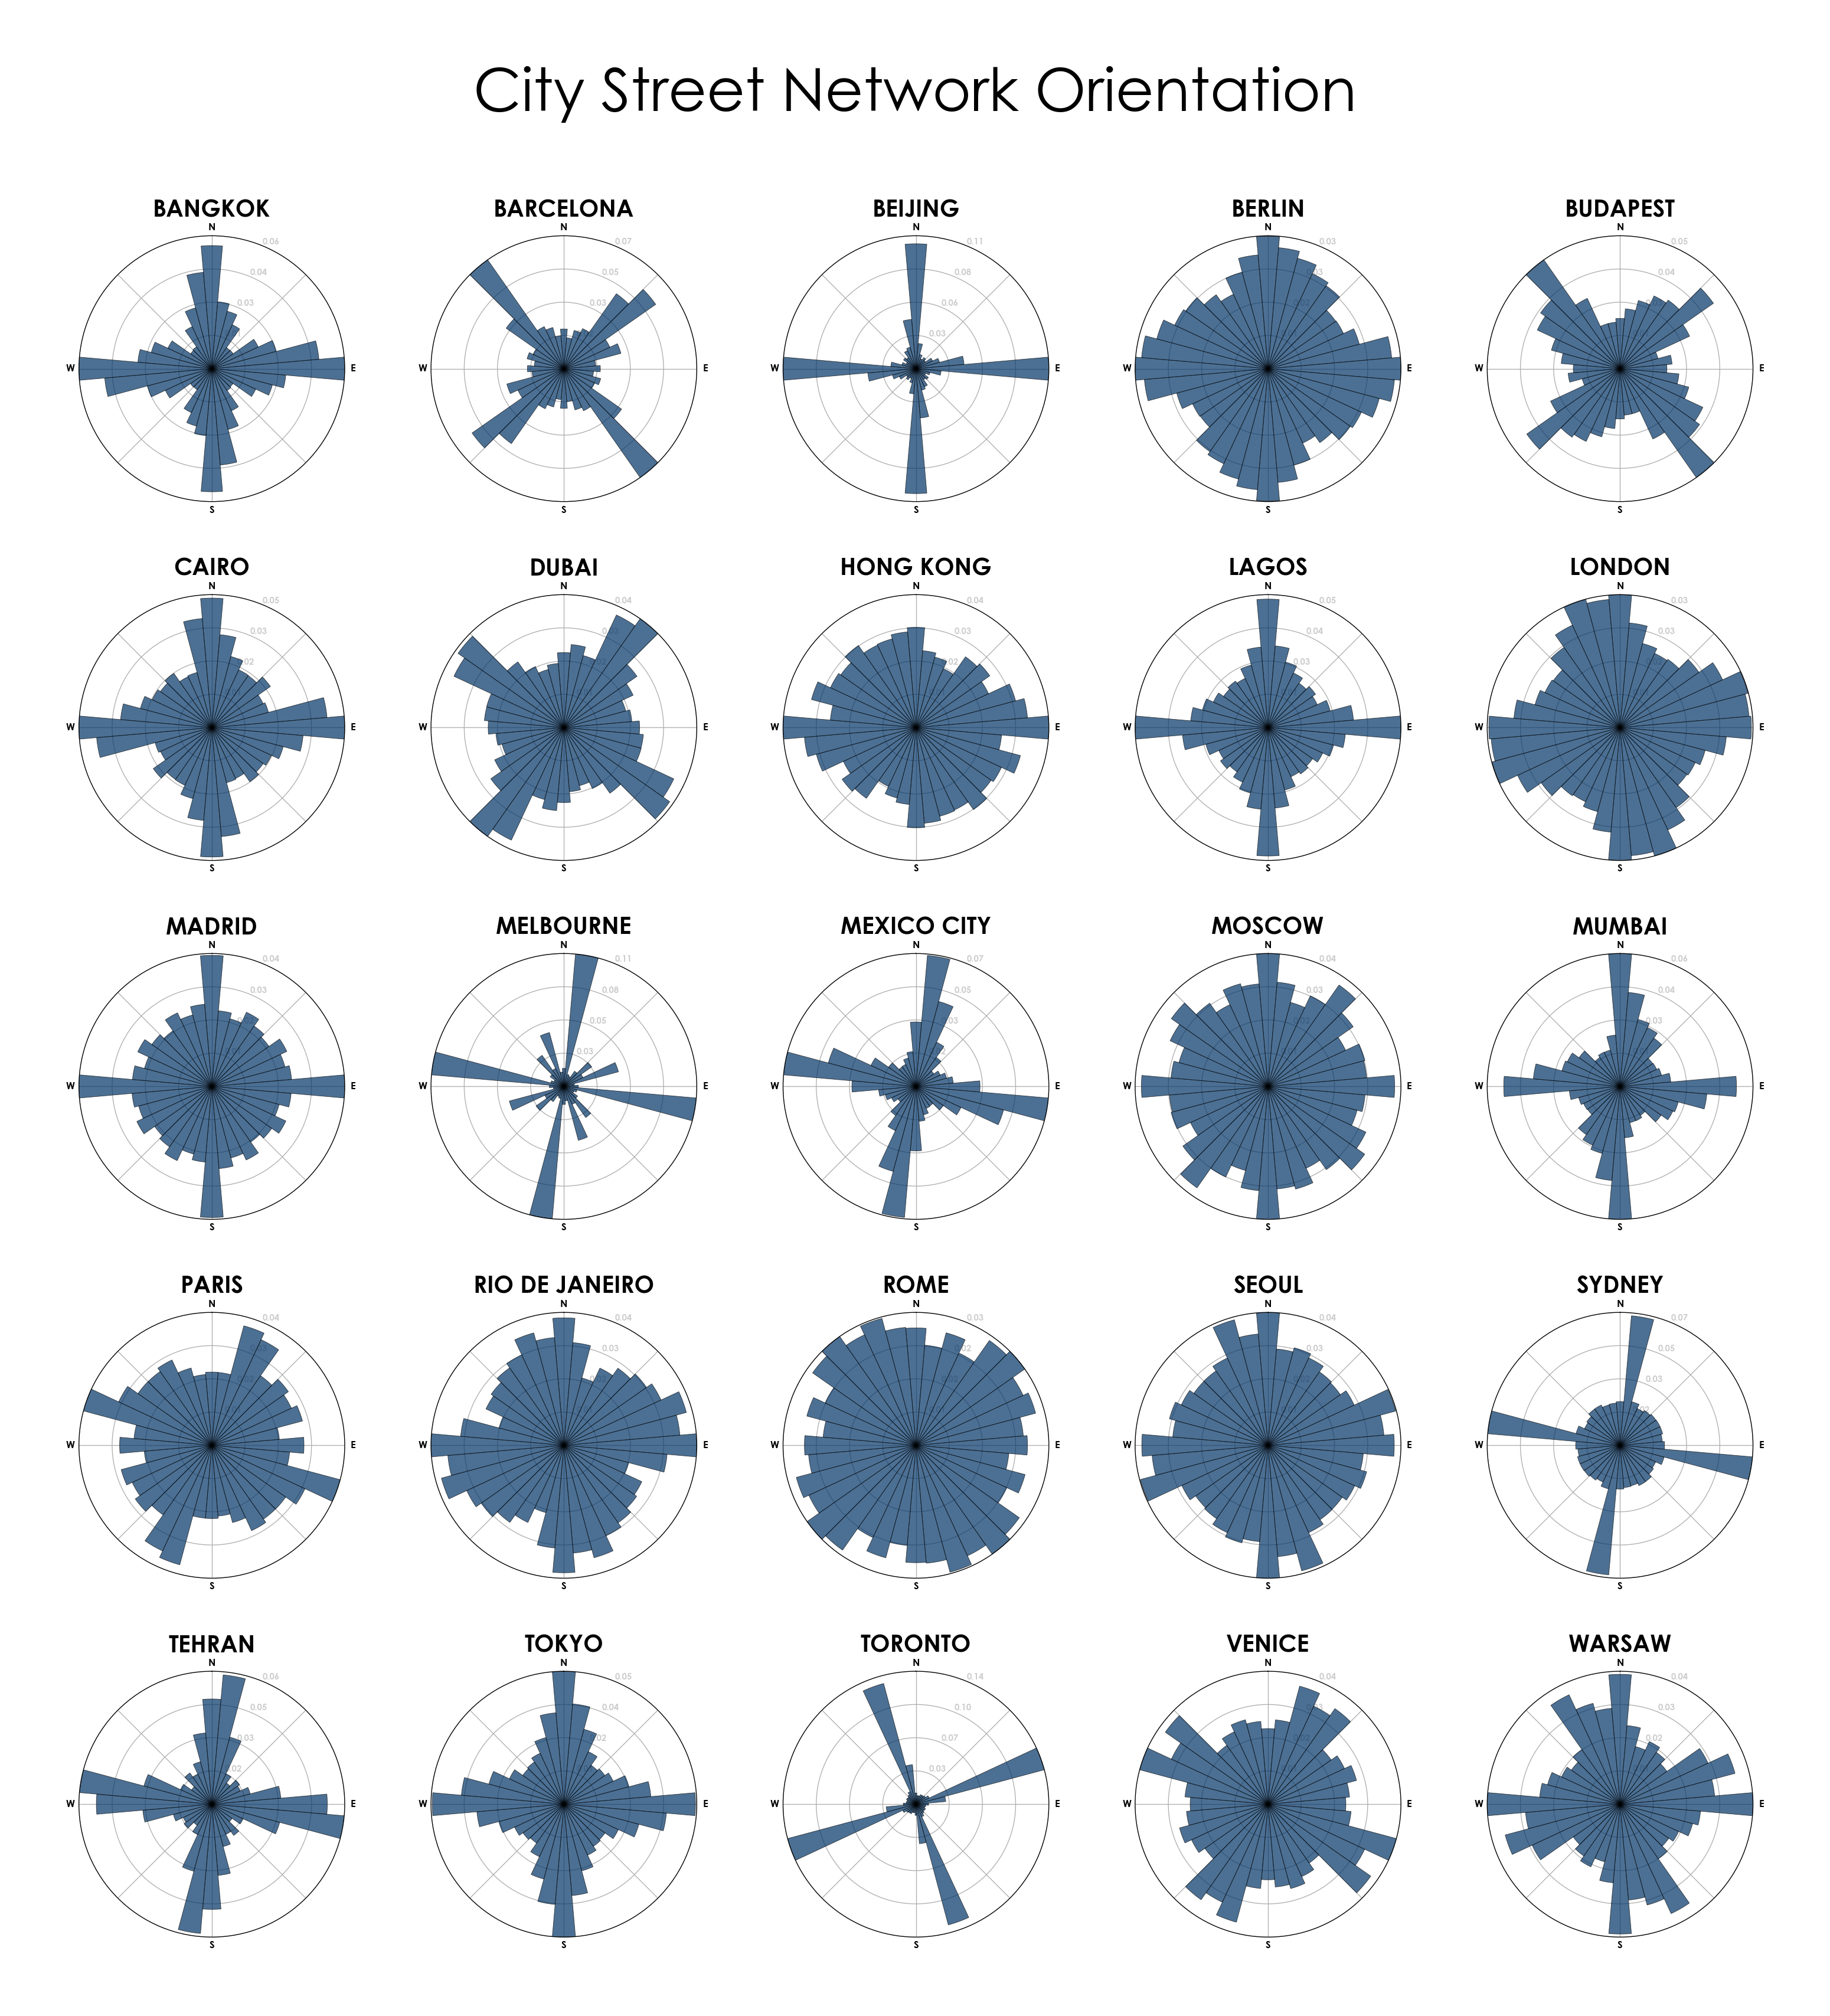
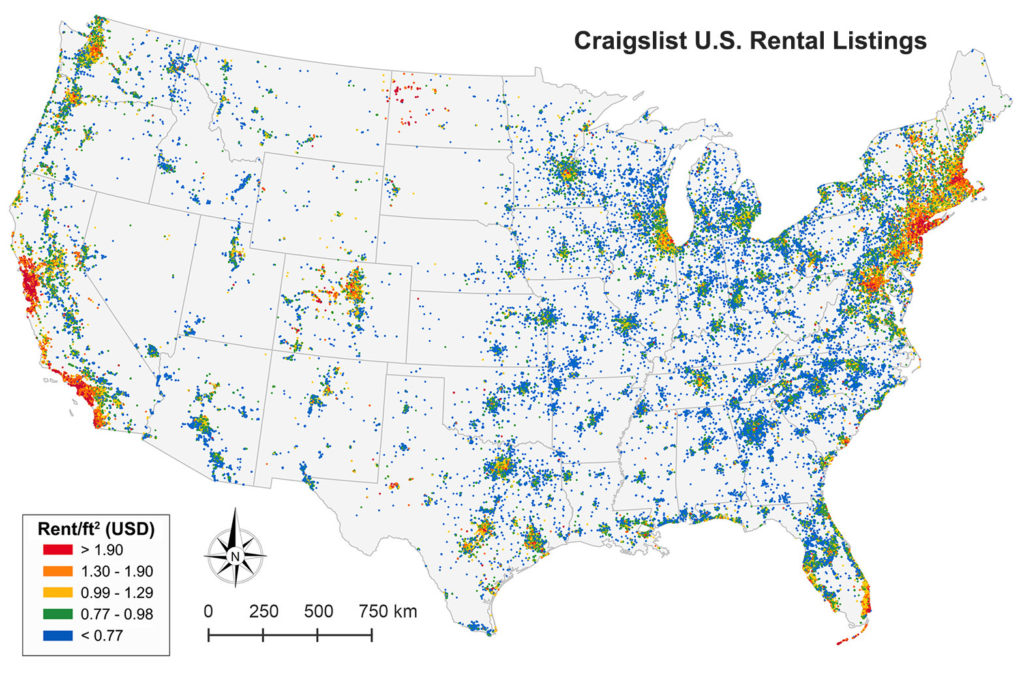
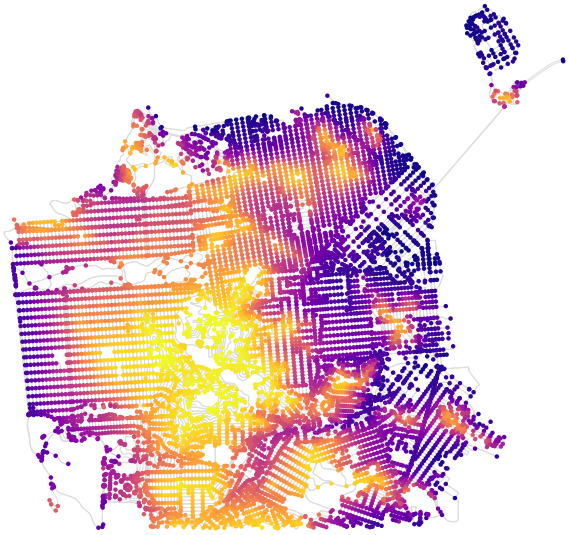
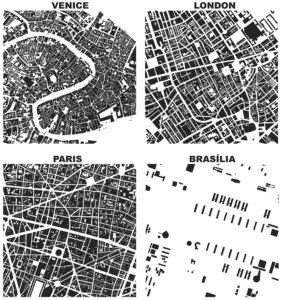
This year will mark the 10th anniversary of my work on the OSMnx project. It recently reached version 2.0 with a slew of new features and enhancements. If you haven’t used it before, OSMnx is a Python package to easily download, model, analyze, and visualize street networks and any other geospatial features from OpenStreetMap. You can download and model walking, driving, or biking networks with a single line of code then quickly analyze and visualize them. You can just as easily work with urban amenities/points of interest, building footprints, transit stops, elevation data, street orientations, speed/travel time, and routing.

For more, check out the article at Geographical Analysis.

Categories
Data

OSMnx 1.0 Is Here

Happy new year! After five years of development and over 2,000 code commits from dozens of contributors, OSMnx v1.0 has officially been released. This has been a long labor of love and I’m thrilled to see it reach this milestone.

Much has changed in recent months with new features added and a few things deprecated. Most of this development occurred in a major overhaul over the summer, which I covered at the time in three previous posts. Among these dozens of enhancements were major speed and efficiency improvements throughout the package, better visualization, a new geometries module for retrieving any geospatial objects from OSM, topological intersection consolidation, and much more. I encourage you to read those posts to familiarize yourself with what’s new.

Categories
Data

What’s New With OSMnx, Part 2

This is a follow-up to last month’s post discussing the many new features, improvements, and optimizations made to OSMnx this summer. As this major improvement project now draws to a close, I will summarize what’s new(er) here. Long story short: there are a bunch of new features and everything in the package has been streamlined and optimized to be easier to use, faster, and more memory efficient.

First off, if you haven’t already, read the previous post about new features including topological intersection consolidation, automatic max speed imputation and travel time calculation, generalized points-of-interest queries, querying OSM by date, and API streamlining. This post covers new changes since then, including improved visualization and plotting, improved graph simplification, the new geocoder module, and other miscellaneous improvements.

Categories
Planning

City Street Orientations around the World

City street network grid orientations, order, disorder, entropy, rose plot, polar histogram made with Python, OSMnx, OpenStreetMap, matplotlib.This post is adapted from this research paper that you can read/cite for more info. It analyzes and visualizes 100 cities around the world.

By popular request, this is a quick follow-up to this post comparing the orientation of streets in 25 US cities using Python and OSMnx. Here are 25 more cities around the world:

City street network grid orientations, rose plot, polar histogram made with Python, OSMnx, OpenStreetMap, matplotlib. Bangkok, Barcelona, Beijing, Budapest, Cairo, Delhi, Dubai, Glasgow, Hong Kong, Lagos, London, Madrid, Melbourne, Mexico City, Moscow, Mumbai, Munich, Paris, Rio de Janeiro, Rome, Seoul, Sydney, Tehran, Toronto, Warsaw, Tokyo, Berlin, Venice

Categories
Academia

New Article: Craigslist Housing Markets in JPER

Our article “New Insights into Rental Housing Markets across the United States: Web Scraping and Analyzing Craigslist Rental Listings” is finally appearing in print in the Journal of Planning Education and Research‘s forthcoming winter issue. We collected, validated, and analyzed 11 million Craigslist rental listings to discover fine-grained patterns across metropolitan housing markets in the United States.

Map of 1.5 million Craigslist rental listings in the contiguous U.S., divided into quintiles by each listing's rent per square foot. Published in JPER: the Journal of Planning Education and Research.

Categories
Data

OSMnx and Street Network Elevation Data

Check out the journal article about OSMnx.

OSMnx can now download street network elevation data for anywhere in the world. In one line of code it downloads the elevation in meters of each network node, and in one more line of code it can calculate every street (i.e., edge) grade. Here is the complete street network of San Francisco, California, with nodes colored according to their elevation:

OSMnx street network elevation data for San Francisco, California to calculate street grade and steepness

Categories
Planning

Urban Form Analysis with OpenStreetMap Data

Figure-ground diagrams of urban form and building footprints in London, Paris, Venice, and Brasilia depict modernism's inversion of traditional spatial orderCheck out the journal article about OSMnx. This is a summary of some of my recent research on making OpenStreetMap data analysis easy for urban planners. It was also published on the ACSP blog.

OpenStreetMap – a collaborative worldwide mapping project inspired by Wikipedia – has emerged in recent years as a major player both for mapping and acquiring urban spatial data. Though coverage varies somewhat worldwide, its data are of high quality and compare favorably to CIA World Factbook estimates and US Census TIGER/Line data. OpenStreetMap imported the TIGER/Line roads in 2007 and since then its community has made numerous corrections and improvements. In fact, many of these additions go beyond TIGER/Line’s scope, including for example passageways between buildings, footpaths through parks, bike routes, and detailed feature attributes such as finer-grained street classifiers, speed limits, etc.

This presents a fantastic data source to help answer urban planning questions, but OpenStreetMap’s data has been somewhat difficult to work with due to its Byzantine query language and coarse-grained bulk extracts provided by third parties. As part of my dissertation, I developed a tool called OSMnx that allows researchers to download street networks and building footprints for any city name, address, or polygon in the world, then analyze and visualize them. OSMnx democratizes these data and methods to help technical and non-technical planners and researchers use OpenStreetMap data to study urban form, circulation networks, accessibility, and resilience.

Categories
Planning

OSMnx: Python for Street Networks

OSMnx: New York City urban street network visualized and analyzed with Python and OpenStreetMap data
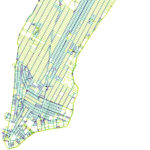
If you use OSMnx in your work, please cite the journal article.

OSMnx is a Python package to retrieve, model, analyze, and visualize street networks from OpenStreetMap. Users can download and model walkable, drivable, or bikeable urban networks with a single line of Python code, and then easily analyze and visualize them. You can just as easily download and work with amenities/points of interest, building footprints, elevation data, street bearings/orientations, and network routing. If you use OSMnx in your work, please download/cite the paper here.

In a single line of code, OSMnx lets you download, model, and visualize the street network for, say, Modena Italy:

import osmnx as ox
ox.plot_graph(ox.graph_from_place('Modena, Italy'))

OSMnx: Modena Italy networkx street network in Python from OpenStreetMap

Categories
Data

Mapping Everywhere I’ve Ever Been in My Life

I recently wrote about visualizing my Foursquare check-in history and mapping my Google location history, and it inspired me to mount a more substantial project: mapping everywhere I’ve ever been in my life (!!). I’ve got 4 years of Foursquare check-ins and Google location history data. For everything pre-smart phone, I typed up a simple spreadsheet of places I’d visited in the past and then geocoded it with the Google Maps API. All my Python and Leaflet code is available in this GitHub repo and is easy to re-purpose to visualize your own location history.

I’ll show the maps first, then run through the process I followed, below. First off, I used Python and matplotlib basemap to create this map of everywhere I’ve ever been:

Location History World Map, data from Foursquare and Google, made with Python matplotlib basemap

Categories
Data

Analyzing Last.fm Listening History

Last.fm is a web site that tracks your music listening history across devices (computer, phone, iPod, etc) and services (Spotify, iTunes, Google Play, etc). I’ve been using Last.fm for nearly 10 years now, and my tracked listening history goes back even further when you consider all my pre-existing iTunes play counts that I scrobbled (ie, submitted to my Last.fm database) when I joined Last.fm.

Using Python, pandas, matplotlib, and leaflet, I downloaded my listening history from Last.fm’s API, analyzed and visualized the data, downloaded full artist details from the Musicbrainz API, then geocoded and mapped all the artists I’ve played. All of my code used to do this is available in this GitHub repo, and is easy to re-purpose for exploring your own Last.fm history. All you need is an API key.

Last.fm artists played the most

First I visualized my most-played artists, above. Across the dataset, I have 279,769 scrobbles (aka, song plays). I’ve listened to 26,761 different artists and 66,377 different songs across 38,026 different albums from when I first started using iTunes circa 2005 through the present day. This includes pretty close to every song I’ve played on anything other than vinyl during that time.