Categories
Data

OSMnx v1.2 Released

OSMnx v1.2.0 has been released. It includes several new features, bug fixes, and performance enhancements. I encourage you to upgrade and take advantage of everything new. For more information, check out the OSMnx documentation and usage examples for demonstrations of all you can do.

Categories
Planning

Framework for Measuring Pedestrian Accessibility

I’m a co-author of a new article, “A Generalized Framework for Measuring Pedestrian Accessibility around the World Using Open Data,” which has just been published by Geographical Analysis. We developed an open source, containerized software framework for modeling pedestrian networks using open data to analyze disaggregate access to daily living needs. We worked with local partners in 25 cities around the world to demonstrate and validate this toolkit.

From the abstract:

Pedestrian accessibility is an important factor in urban transport and land use policy and critical for creating healthy, sustainable cities. Developing and evaluating indicators measuring inequalities in pedestrian accessibility can help planners and policymakers benchmark and monitor the progress of city planning interventions. However, measuring and assessing indicators of urban design and transport features at high resolution worldwide to enable city comparisons is challenging due to limited availability of official, high quality, and comparable spatial data, as well as spatial analysis tools offering customizable frameworks for indicator construction and analysis. To address these challenges, this study develops an open source software framework to construct pedestrian accessibility indicators for cities using open and consistent data. It presents a generalized method to consistently measure pedestrian accessibility at high resolution and spatially aggregated scale, to allow for both within- and between-city analyses. The open source and open data methods developed in this study can be extended to other cities worldwide to support local planning and policymaking. The software is made publicly available for reuse in an open repository.

For more, check out the article.

Categories
Data

OSMnx v1.1 Released

OSMnx v1.1.0 has been released. It includes several new features, bug fixes, and performance enhancements. I encourage you to upgrade and take advantage of everything new. I’ll summarize some of the key improvements in this post.

Categories
Data

OSMnx 1.0 Is Here

Happy new year! After five years of development and over 2,000 code commits from dozens of contributors, OSMnx v1.0 has officially been released. This has been a long labor of love and I’m thrilled to see it reach this milestone.

Much has changed in recent months with new features added and a few things deprecated. Most of this development occurred in a major overhaul over the summer, which I covered at the time in three previous posts. Among these dozens of enhancements were major speed and efficiency improvements throughout the package, better visualization, a new geometries module for retrieving any geospatial objects from OSM, topological intersection consolidation, and much more. I encourage you to read those posts to familiarize yourself with what’s new.

Categories
Urban

Urban Form and OpenStreetMap

My chapter “Exploring Urban Form Through OpenStreetMap Data: A Visual Introduction” has just been published in the new book Urban Experience and Design: Contemporary Perspectives on Improving the Public Realm edited by Justin Hollander and Ann Sussman.

From the abstract:

This chapter introduces OpenStreetMap—a crowdsourced, worldwide mapping project and geospatial data repository—to illustrate its usefulness in quickly and easily analyzing and visualizing planning and design outcomes in the built environment. It demonstrates the OSMnx toolkit for automatically downloading, modeling and visualizing spatial data from OpenStreetMap. We explore patterns and configurations in street networks and buildings around the world computationally through visualization methods—including figure-ground diagrams and polar histograms—that help compress urban complexity into comprehensible artifacts that reflect the human experience of the built environment. Ubiquitous urban data and computation can open up new urban form analyses from both quantitative and qualitative perspectives.

For more, check out the chapter.

Categories
Planning

Off the Grid… and Back Again?

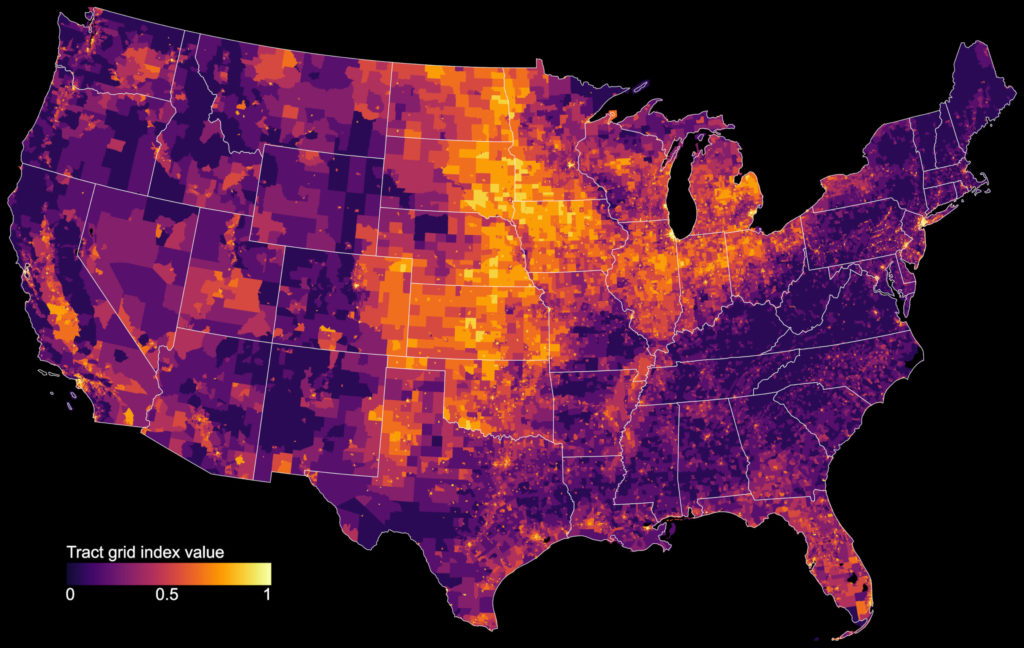
My article “Off the Grid… and Back Again? The Recent Evolution of American Street Network Planning and Design” has been published by the Journal of the American Planning Association and won the 2020 Stough-Johansson Springer Award for best paper. It identifies recent nationwide trends in American street network design, measuring how urban planners abandoned the grid and embraced sprawl over the 20th century, but since 2000 these trends have rebounded, shifting back toward historical design patterns. In this post I discuss these findings and visualizations across the US today as well as over time, then discuss my analysis methods.

Map of where street grids exist today across the US, made with OSMnx and Python

Categories
Planning

Off the Grid at TRB

I am presenting my ongoing research into the recent evolution of American street network planning and design at the annual meeting of the Transportation Research Board in Washington DC on January 13. This presentation asks the question: how has street network design changed over time, especially in recent years? I analyze the street networks of every US census tract and estimate each’s vintage.

Street network designs grew more disconnected, coarse-grained, and circuitous over the 20th century… but the 21st century has witnessed a promising rebound back toward more traditional, dense, and interconnected grids. Higher griddedness is associated with less car ownership, even when controlling for related socioeconomic, topographical, and other urban factors.

Update: the paper has been published in JAPA.

Categories
Urban

Big Data in Urban Morphology

My new article “Spatial Information and the Legibility of Urban Form: Big Data in Urban Morphology” has been published in the International Journal of Information Management (download free PDF). It builds on recent work by Crooks et al, presenting workflows to integrate data-driven and narrative approaches to urban morphology in today’s era of ubiquitous urban big data. It situates this theoretically in the visual culture of planning to present a visualization-mediated interpretative process of data-driven urban morphology, focusing on transportation infrastructure via OSMnx.

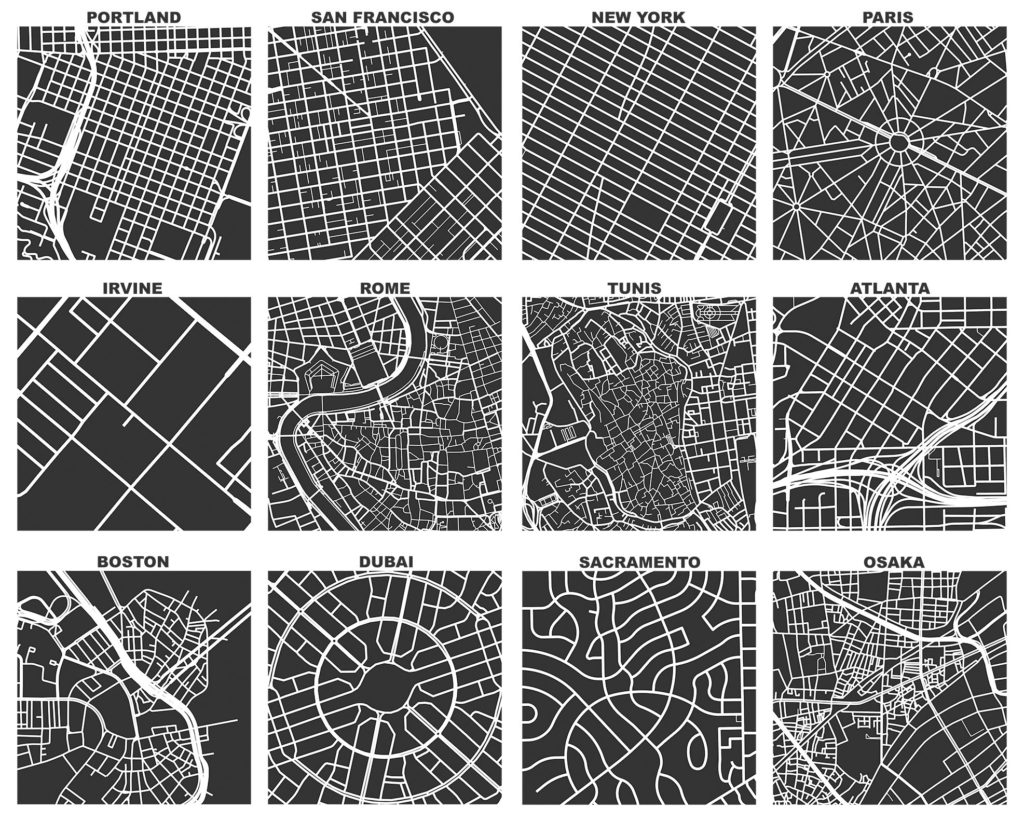
OSMnx: Figure-ground diagrams of one square mile of each street network, from OpenStreetMap, made in Python with matplotlib, geopandas, and NetworkX

Categories
Urban

Urban Street Network Orientation

My new article, Urban Spatial Order: Street Network Orientation, Configuration, and Entropy, has just been published in one of my favorite journals: Applied Network Science (download free PDF). This study explores the spatial signatures of urban evolution and central planning. It examines street network orientation, connectivity, granularity, and entropy in 100 cities around the world using OpenStreetMap data and OSMnx for modeling and visualization:

City street network grid orientations, order, disorder, entropy, rose plot, polar histogram made with Python, OSMnx, OpenStreetMap, matplotlib.

So, who’s got a grid and who doesn’t? Each of the cities above is represented by a polar histogram (aka rose diagram) depicting how its streets orient. Each bar’s direction represents the compass bearings of the streets (in that histogram bin) and its length represents the relative frequency of streets with those bearings. The cities above are in alphabetical order. Here they are again, re-sorted from most-ordered/gridded city (Chicago) to most-disordered (Charlotte):

Categories
Data

US Street Network Models and Measures

My new article, “Street Network Models and Measures for Every U.S. City, County, Urbanized Area, Census Tract, and Zillow-Defined Neighborhood” has been published in Urban Science. This paper reports results from a broader project that collected raw street network data from OpenStreetMap using the Python-based OSMnx software for every U.S. city and town, county, urbanized area, census tract, and Zillow-defined neighborhood boundary. It constructed nonplanar directed multigraphs for each and analyzed their structural and morphological characteristics.

The resulting public data repository contains over 110,000 processed, cleaned street network graphs (which in turn comprise over 55 million nodes and over 137 million edges) at various scales—comprehensively covering the entire U.S.—archived as reusable open-source GraphML files, node/edge lists, and ESRI shapefiles that can be immediately loaded and analyzed in standard tools such as ArcGIS, QGIS, NetworkX, graph-tool, igraph, or Gephi.