Categories
Planning

City Street Orientations around the World

City street network grid orientations, order, disorder, entropy, rose plot, polar histogram made with Python, OSMnx, OpenStreetMap, matplotlib.This post is adapted from this research paper that you can read/cite for more info. It analyzes and visualizes 100 cities around the world.

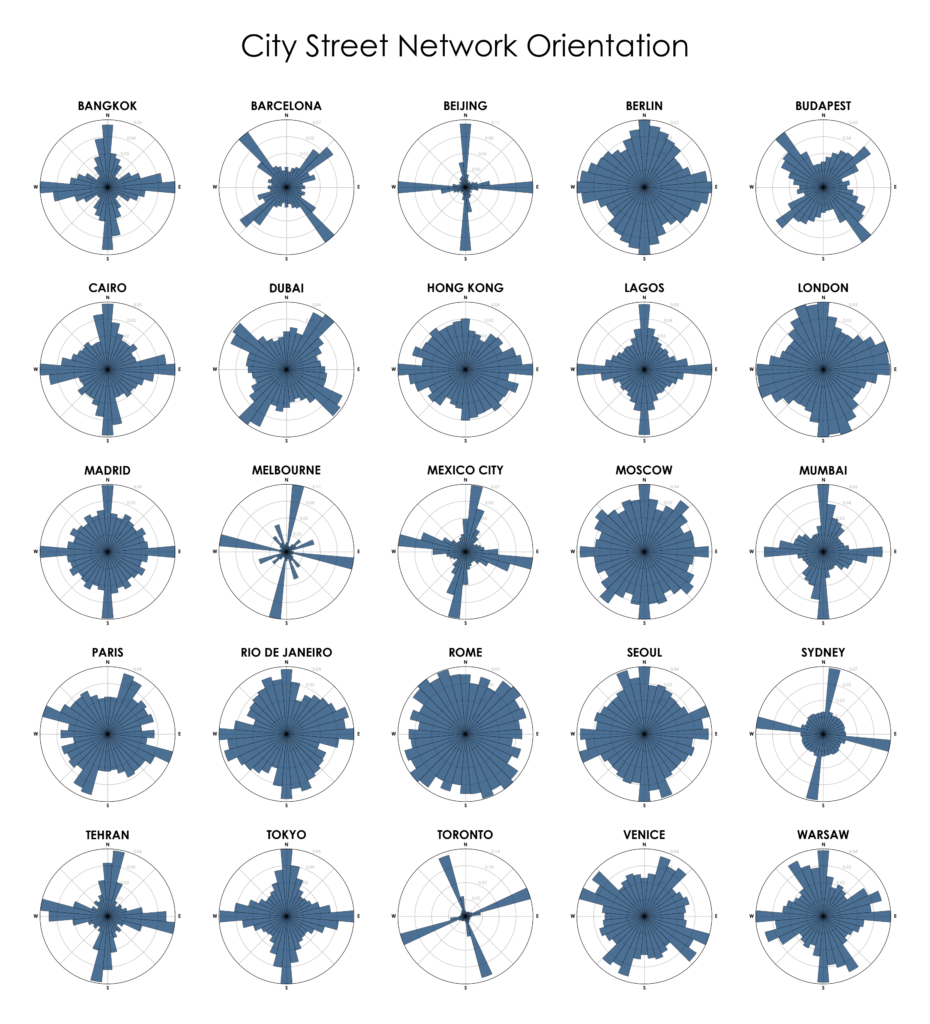
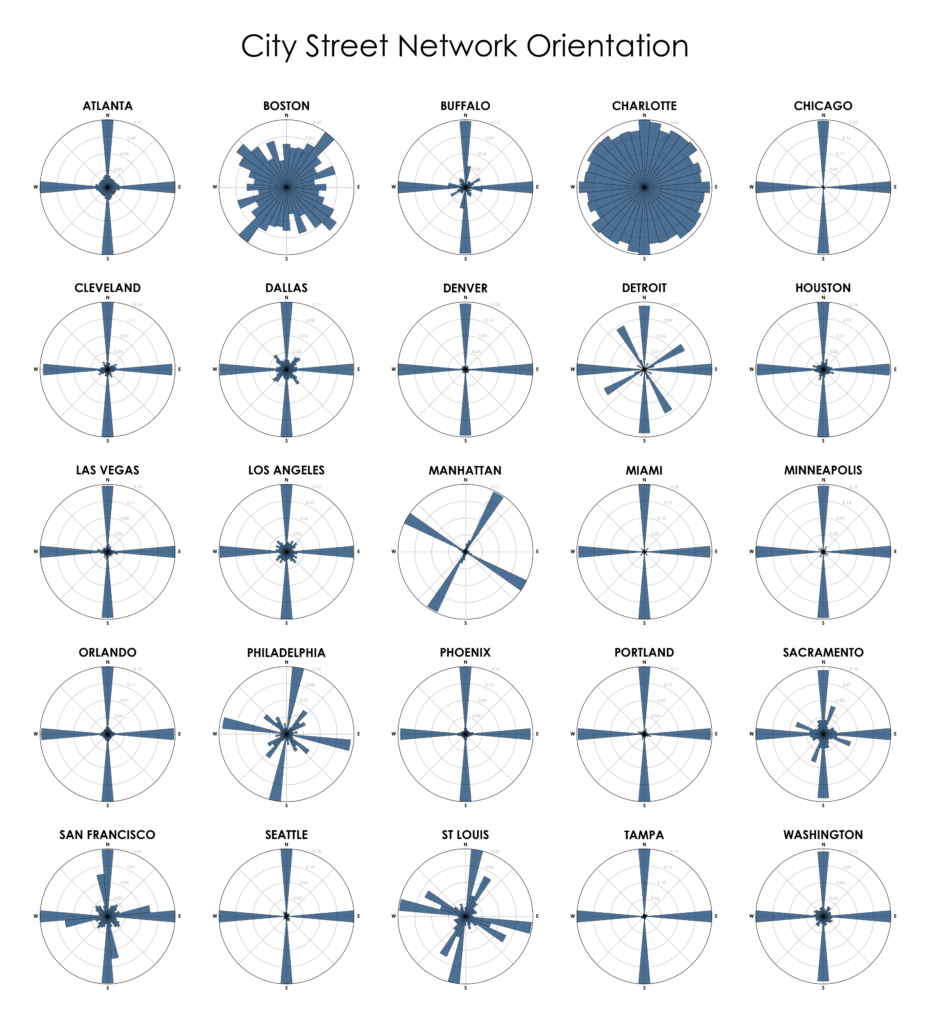
By popular request, this is a quick follow-up to this post comparing the orientation of streets in 25 US cities using Python and OSMnx. Here are 25 more cities around the world:

City street network grid orientations, rose plot, polar histogram made with Python, OSMnx, OpenStreetMap, matplotlib. Bangkok, Barcelona, Beijing, Budapest, Cairo, Delhi, Dubai, Glasgow, Hong Kong, Lagos, London, Madrid, Melbourne, Mexico City, Moscow, Mumbai, Munich, Paris, Rio de Janeiro, Rome, Seoul, Sydney, Tehran, Toronto, Warsaw, Tokyo, Berlin, Venice

And for reference, here’s the original that looked only at American cities:

City street network grid orientations, rose plot, polar histogram made with Python, OSMnx, OpenStreetMap, matplotlib. Atlanta, Boston, Buffalo, Charlotte, Chicago, Cleveland, Dallas, Denver, Detroit, Houston, Las Vegas, Los Angeles, Manhattan, New York, Miami, Minneapolis, Orlando, Philadelphia, Phoenix, Portland, Sacramento, San Francisco, Seattle, St Louis, Tampa, Washington DC.

Want to see more cities? This post is adapted from this research paper that analyzes and visualizes 100 cities around the world, discussing these methods, entropy calculations, and images in more detail. And for more on OSMnx, check out the original post or this post about OSMnx.

91 replies on “City Street Orientations around the World”

Even better, I’d love to see Tokyo as well as Kyoto, because the history of the planning for those two cities is so different!

I second this, I came on here specifically looking for Tokyo because I know from experience its streets are crazy.

I think that Tokyo would be similar to Seoul, as both have streets going in just about every direction.

I think it’s not so much the fact that the street orientations are crazy in Tokyo (though they are that, to be sure), but more so the addressing system that really gave me trouble the many years I lived in Japan. Even many native Japanese I know concede that it can be frustratingly difficult to give directions in a Japanese city. It does make Japan a charming place to get lost however.

may it be that for Rome you have considered the whole province or Rome and not just the city?

I’m surprised about İstanbul. I would have expected it to center more on the 45s due to the Bosporus and the marmara sea not running north-south.

Me too! It’s got so many grids that are in so many different directions, I wonder what the average of them all ends up being.

Most of Melbourne’s grid was laid out according to magnetic north, not true north, hence the ~8 degree rotation.

It would be interesting to compare the city street orientation to traffic accident rate. I have witnessed several accidents where the driver claimed to be vision-impaired by sunlight.
A street orientation like in Barcelona would solve that problem.

Seasonal variation in sunrise / sunset azimuth would mean you’d still get Barcelona winter sunrise heading southeast in the morning and sunset heading southwest in the evening

I wonder how these would compare to polar plots of street orientations that are weighted by traffic volumes.

Is there a way of automating this histogram generator to allow people to pick the cities they care about?

Many cities with medieval origins have essentially a polar coordinate system with a central square (often at a church) and some roads in the “spoke” direction and others in the “circumference” direction. An analysis of cities based on Cartesian coordinates will not do the regular order of these cities justice.

This is certainly the case for Paris, which is perfectly “legible” when understood as wheels and spokes divided into inner and outer slices (arrondissement).

It would be interesting to have direction of major geographical feature on the plots.

Clearly New York and Barcelona are based on the sea shore.

While Budapest and Warsaw on the main river.

How did you get Glasgow to work? When I substitute it into your notebook it returns a point geometry at the gdf_from_places call and then fails in graph_from_place.

Hmmm. That still returns a point for me. I also tried
‘Glasgow, UK’
‘Glasgow, Scotland’
‘Glasgow’

Each returned ‘Glasgow, Glasgow City, Scotland, G, UK’ as the place_name in the table & POINT (-4.2435817 55.856656) as geometry after gdf_from_places call.

Cairo is only vaguely aligned along the cardinal directions because of the Nile.

I suggest for a fun American city try New Orleans. The lack of cardinality here is no notorious that no one uses the cardinal directions. The curvature of the river forces a lot of changes in the grid orientation of the city.

I’d love to see these charts ordered by the founding date of that city

Thanks for sharing your interesting work! Can we assume that some cities are originally designed for cars (driving from one place to another easily) and some cities are not? For example, Atlanta versus Rome or Denver versus Paris?

Vienna, Austria would be interesting since it is relatively regular but expands from a central point, especially from the older parts of the city.

As you get to what some may call suburbs (not like those in the USA, but rather far more residential than non-residential) things change a bit, partially due to geography and more modern ideals.

Great visualisations! Wonder how Amsterdam would look like using this algorithm. Probably comparable with Paris or London?

I had the exact same though — Amsterdam was the first city that came to mind after reading this.

Boston makes a whole lot more sense if you go back and look at a pre-in-fill map. There are multiple different grids based on the wide points in the land, that neck down to pass through isthmii. Then the land around an isthmus got filled in, and the new development followed the new coast line. Then repeat.

Great piece. I’m interested in insights for the city of Brighton & Hove (voted most hipster city in the world this year) on the south coast of England. Back history is that it developed from a fishing village to an 18th century resort town to a tourism/education/creative city today. It has an inverted ‘T’ transport profile major rail links North, East and West (south is sea with no shipping communication). Do you or anyone know of a similar inverted ‘T’ city? I’m looking for public transport insights that might be transferrable. Thank you.

It would be interesting to see Bogotá or another city in Colombia, as Colombia takes the system of numbering streets (calles) and avenues (carreras) to an extreme I’ve never come across elsewhere, and uses it even in the smallest villages.

Wow. This is super interesting. I wonder what Indian cities like Delhi, Chandigarh would look like. Being a planned city Chandigarh might be more organized than Delhi.

Have you taken a look at a map of Denver? There’s a section of the city that is rotated 45 degrees with respect to everything else, but there is no trace of that in the plot for Denver.

Orientation to (historic) magnetic north appears to explain the primary orientation of Melbourne (+11.38′), Sydney (+12.35′), and possibly also Mexico City(+4.37′), Seoul (-8.28′), Tehran (+4.46′) and Toronto (-10.30′).

Magnetic declination changes slowly so cities laid out hundreds of years ago will diverge from current declination.

Most of Australia appears to have been surveyed / laid out using magnetic declination around 150-200 years ago, so relatively close to current declination.

Toronto streets are roughly parallel or perpendicular to the Lake Ontario coastline. This is generally the case throughout peninsular Ontario. In the centre of the peninsula (Kitchener / Waterloo area) the township grids come together in a muddle.

Congratulations on your new job. I love your graphs, it allows me to look at the world in ways I had not thought of. I hope you will continue creating them.

Hey ! I am completely new to coding and would like to do this for some cities in my country (Belgium). I found the code to make polar histograms and this works great, so thank you for that ! I haven’t found an example on how to calculate the Shannon entropy and thereafter the grid order. Do you have examples on how to do this ?
Many thanks!

[…] Para resolver este problema, tomó la información de OSM y una librería para grafos del lenguaje de programación Python (llamado en base al grupo cómico inglés Monthy Python) y creó Osmnx. Esta herramienta justamente nos permitió encontrar el camino más corto en el ejemplo anterior. También permite, por ejemplo, ver la orientación de las calles de las ciudades del mundo: […]

Just playing with Google Maps in South America. Whether looking at major cities or tiny villages, the trend is very clearly for primary roadways to orient northeast to southwest with varying degrees of rotation from cardinal N-S. Is there a cultural reason? It is not purely geographical (following waterways or terrain).

Leave a Comment