New Article: Urban Street Networks in EP-B
My article, “A Multi-Scale Analysis of 27,000 Urban Street Networks: Every US City, Town, Urbanized Area, and Zillow Neighborhood,” was recently published in Environment and Planning B: Urban Analytics and City Science. This study uses OSMnx to download and analyze 27,000 street networks from OpenStreetMap at metropolitan, municipal, and neighborhood scales - namely, every US city and town, census urbanized area, and Zillow-defined neighborhood. It illustrates the use of OSMnx and OpenStreetMap to consistently conduct street network analysis with extremely large sample sizes, with clearly defined network definitions and extents for reproducibility, and using nonplanar, directed graphs.
These 27,000 street networks as well as their measures have been shared in a free public repository at the Harvard Dataverse for anyone to re-purpose. This study’s empirical findings emphasize measures relevant to graph theory, transportation, urban design, and morphology, such as structure, connectedness, density, centrality, and resilience. It uses graph Maximum Betweenness Centrality and Average Node Connectivity to examine how “resilient” a street network is, in terms of how reliant it is on important nodes and how easy it is to disconnect it.
The characteristics of city street networks fundamentally depend on what “city” means: municipal boundaries, urbanized areas, or certain central neighborhoods? The first is a legal/political definition, but captures the scope of city planning authority and decision-making for top-down interventions into human circulation. The second captures a wider self- organized human system and its emergent built form (as well as the jurisdiction of MPOs), but tends to aggregate multiple heterogeneous forms together into a single unit of analysis. The third captures the nature of the local built environment and lived experience, but at the expense of a broader view of the urban system and metropolitan-scale trip-taking. In short, multiple scales in concert provide planners a clearer view of the urban form and the topological and metric character of the street network than any single scale can.
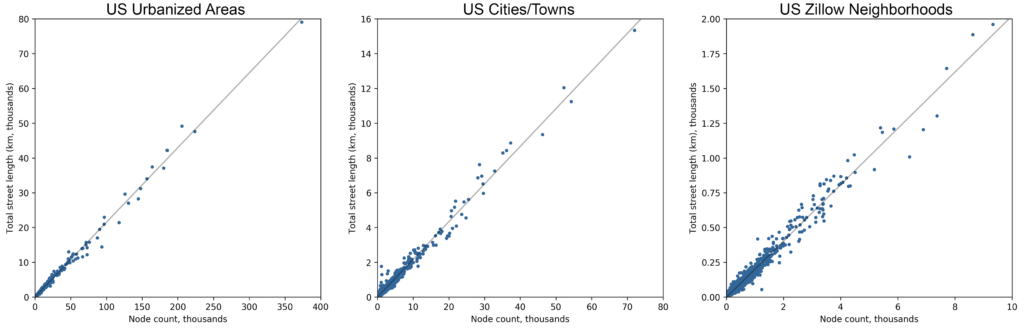
This analysis finds a strong linear relationship, across scales, between total street length and the number of nodes in a network (figure above). This differs from previous findings in the literature that relied on smaller sample sizes and examined European instead of US cities.
We also find that most networks typically follow right-skewed distributions of street segment lengths (particularly exponentiated-Weibull). This makes sense theoretically and is supported by these large-sample data at multiple scales, but obvious exceptions exist in those networks that exhibit substantial uniformity. At the neighborhood scale, examples include downtowns with consistent orthogonal grids, such as that of Portland, Oregon. At the municipal scale, examples include towns in the Great Plains that have orthogonal grids with consistent block sizes, platted at one time, and never subjected to expansion or sprawl.
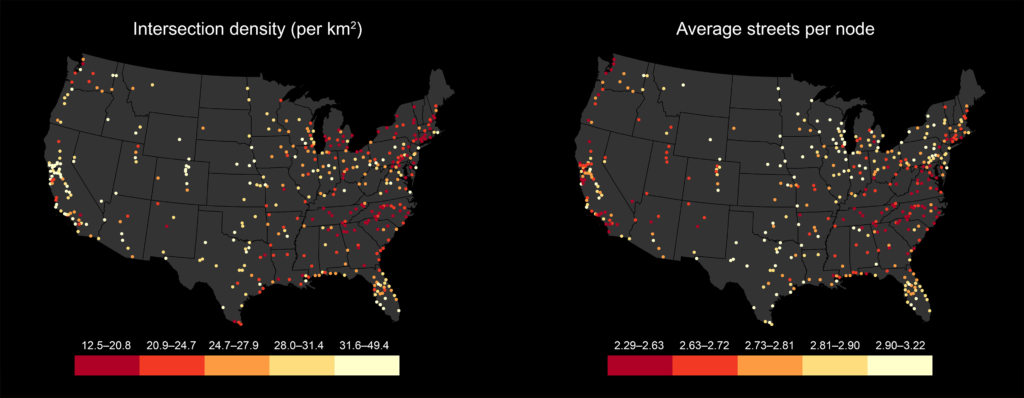
Looking across US urbanized areas, we can see clear patterns in intersection density and the average number of streets per node (figure above). The former indicates the density and grain of the street network: California, Florida, and the Great Plains tend to be denser than, for instance, the Upper South and the Northeast. The latter indicates connectedness (and by proxy suggests griddedness): the Midwest and Great Plains tend to have particularly high connectedness, while the Upper South tends to be particularly low. These patterns illustrate the urban form legacies of the practice and history of US planning: the spatial signatures of the Homestead Act, successive land use regulations, urban design paradigms, and planning instruments remain clearly etched in these cities’ urban forms and street networks today.
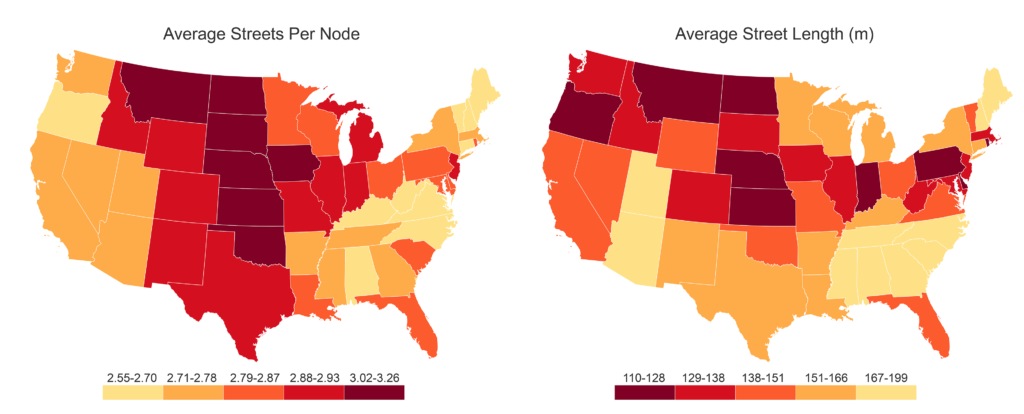
For instance (and unsurprising given this history), if we measure the average number of streets per node at the city-scale and then aggregate these cities by state, we find Nebraska, Kansas, South Dakota, Montana, North Dakota, Oklahoma, and Iowa have, in order, the highest median values (figure above). When comparing median municipal street networks across states, Nebraska has the lowest circuity, the highest average number of streets per node, the second shortest average street segment length, and the second highest intersection density. Street networks across the Great Plains developed quickly but grew very little afterwards, unlike, for instance, cities in California that were settled in the same era but later subjected to sprawl and late 20th century planning/design paradigms.
For more, check out the article here or see here for more info on OSMnx.