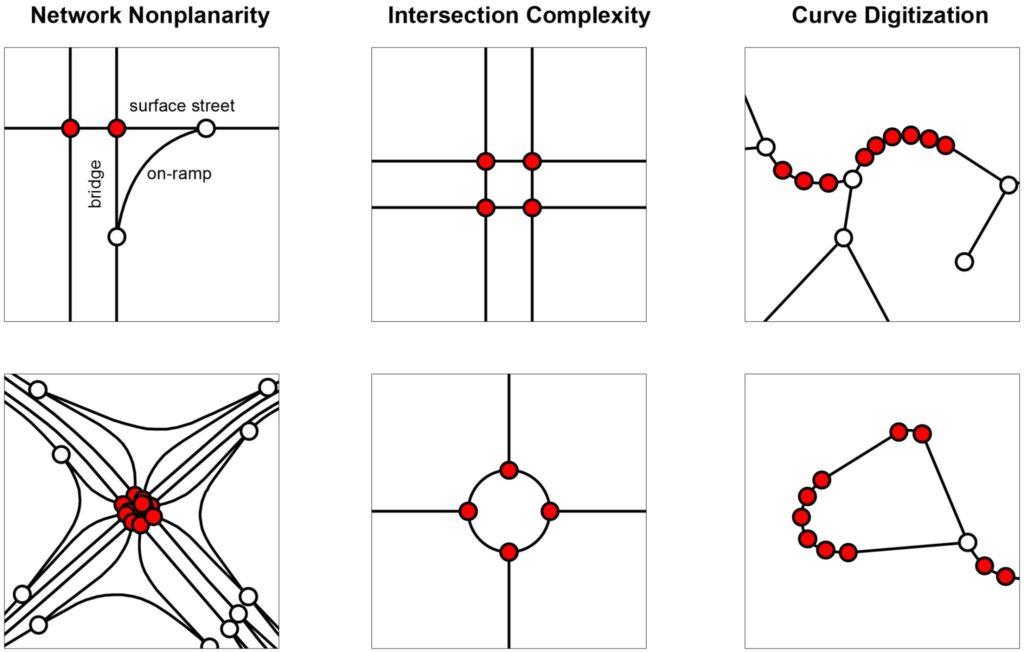
How many street intersections do you see in this figure? I have a new article published this week in Transactions in GIS (open-access) and its first sentence sums it up: “Counting is hard.” Hear me out… it really is!
 Most real-world objects belong to fuzzy categories, resulting in subjective decisions about what to include or exclude from counts. Yet this complexity is often obscured by a superficial impression that counting is easy to do because its mechanics seem easy to understand. After all, everyone learns to count in kindergarten by simply enumerating the elements in a set. But counting is hard because defining that set and identifying its members are often nontrivial tasks. Many of the world’s most important analytics rely far less on flashy data science techniques than they do on counting things well and justifying those counts effectively.
Street intersection counts and densities are ubiquitous measures in transportation geography and planning. However, typical street network data and typical street network analysis tools can substantially overcount them. This article explains the 3 main reasons why this happens and presents solutions to each.
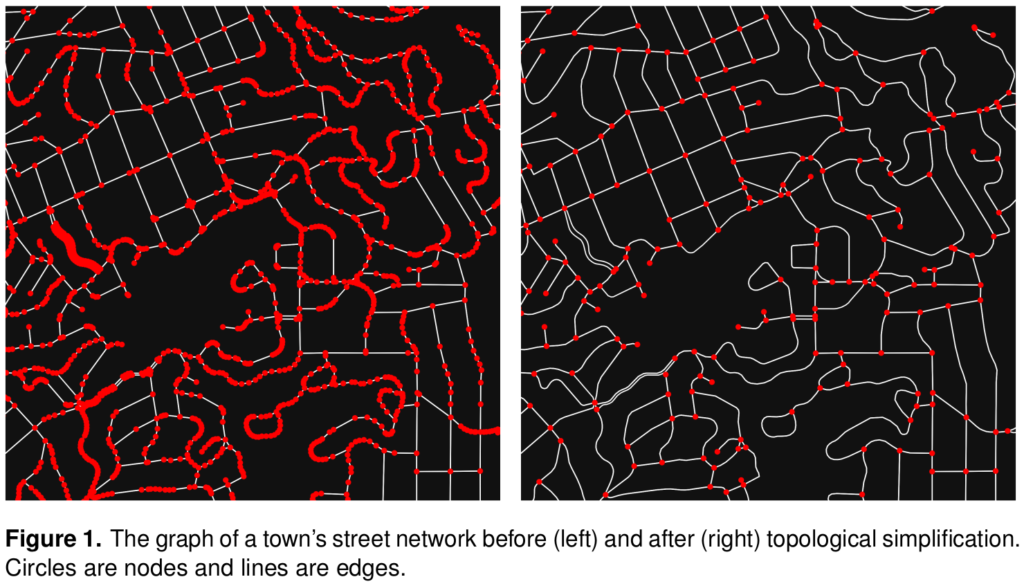
Street intersections, particularly the complex kind common in modern car-centric urban areas, are fuzzy objects for which most data sources do not provide a simple 1:1 representation. This results in spatial uncertainty due to data challenges in representing network nonplanarity, intersection complexity, and curve digitization. Essentially all data sources suffer from at least 1 of these problems due to difficulties representing divided roads, slip lanes, roundabouts, interchanges, complex turning lanes, etc. If unaddressed, my assessment shows that typical intersection counts (and downstream densities) would be overestimated by >14%, but very unevenly so in different parts of the world. This bias’s extreme heterogeneity particularly hinders comparative urban analytics. Mitigating these 3 problems is a project I’ve been iteratively refining for the past decade. It was a central focus of my dissertation and a key motivation for originally developing OSMnx. This article presents OSMnx’s algorithms to automatically simplify spatial graphs of urban street networks—via edge simplification and node consolidation—resulting in faster parsimonious models and more accurate network measures like intersection counts and densities, street segment lengths, and node degrees. These algorithms’ information compression drastically improves downstream graph analytics’ memory and runtime efficiency, boosting analytical tractability without loss of model fidelity.
Counting is hard, but we can make it a little easier by using better models. For more, check out the open-access article.

