Categories
Data

GIS and Computational Notebooks

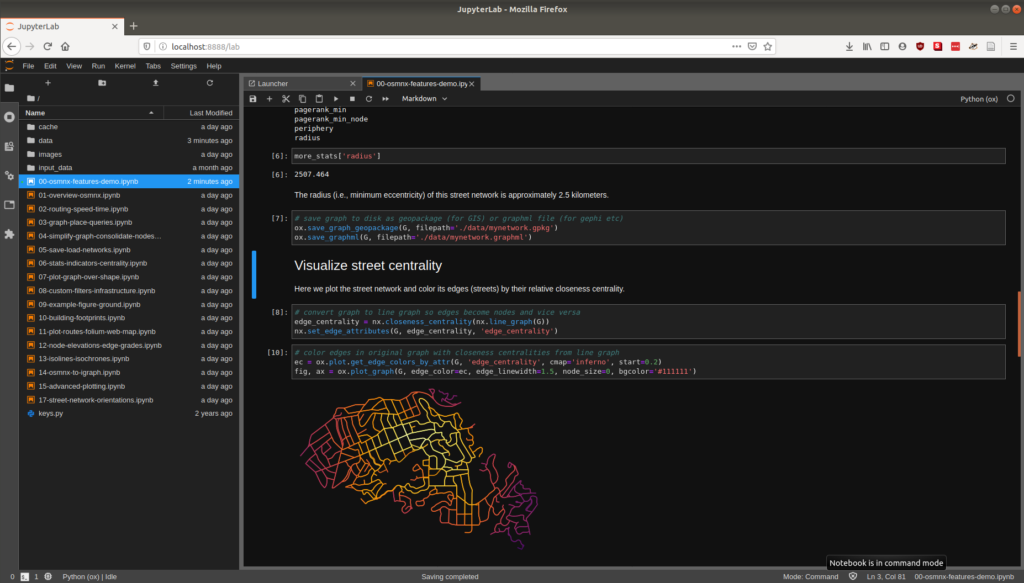
I have a new chapter “GIS and Computational Notebooks,” co-authored with Dani Arribas-Bel, out now in The Geographic Information Science & Technology Body of Knowledge. Want to make your spatial analyses more reproducible, portable, and well-documented? Our chapter is a short, gentle intro to using code and notebooks for modern GIS work.

Science and analytics both struggle with reproducibility, documentation, and portability. But GIS in both research and practice particularly suffers from these problems due to some of its unique characteristics. Our chapter discusses this challenge and its urgency for building better and more actionable knowledge from geospatial data. Then we introduce an emerging solution, the computational notebook, using Jupyter as our central example to illustrate what it does and how it works.

Jupyter notebook JupyterLab user interface

Categories
Urban

Urban Form and OpenStreetMap

My chapter “Exploring Urban Form Through OpenStreetMap Data: A Visual Introduction” has just been published in the new book Urban Experience and Design: Contemporary Perspectives on Improving the Public Realm edited by Justin Hollander and Ann Sussman.

From the abstract:

This chapter introduces OpenStreetMap—a crowdsourced, worldwide mapping project and geospatial data repository—to illustrate its usefulness in quickly and easily analyzing and visualizing planning and design outcomes in the built environment. It demonstrates the OSMnx toolkit for automatically downloading, modeling and visualizing spatial data from OpenStreetMap. We explore patterns and configurations in street networks and buildings around the world computationally through visualization methods—including figure-ground diagrams and polar histograms—that help compress urban complexity into comprehensible artifacts that reflect the human experience of the built environment. Ubiquitous urban data and computation can open up new urban form analyses from both quantitative and qualitative perspectives.

For more, check out the chapter.

Categories
Planning

Off the Grid… and Back Again?

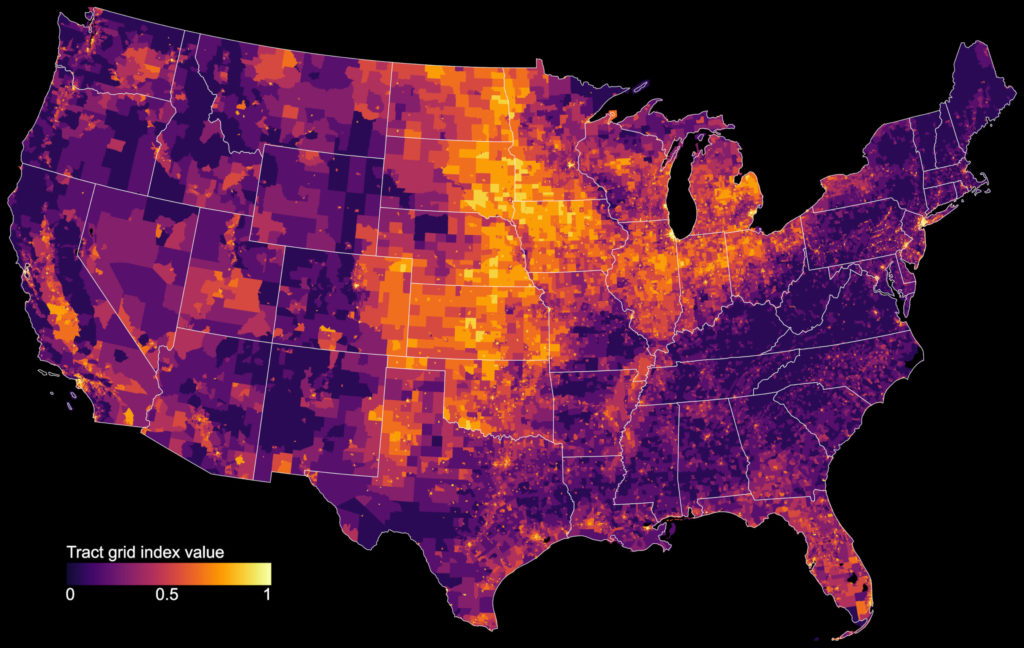
My article “Off the Grid… and Back Again? The Recent Evolution of American Street Network Planning and Design” has been published by the Journal of the American Planning Association and won the 2020 Stough-Johansson Springer Award for best paper. It identifies recent nationwide trends in American street network design, measuring how urban planners abandoned the grid and embraced sprawl over the 20th century, but since 2000 these trends have rebounded, shifting back toward historical design patterns. In this post I discuss these findings and visualizations across the US today as well as over time, then discuss my analysis methods.

Map of where street grids exist today across the US, made with OSMnx and Python

Categories
Academia

Geospatial Tool Building

My new article “The Right Tools for the Job: The Case for Spatial Science Tool-Building” has been published in Transactions in GIS (free PDF). I originally presented this paper as the 8th annual Transactions in GIS plenary address at the AAG annual meeting last year. I argue that tool-building is an essential but poorly incentivized component of academic geography and social science more broadly. To conduct better science, we need to build better tools. Better tools and data models, spearheaded by academics, can help infuse theory into our field’s quantitative work where it is too often lacking. But if we want better tools, we have to build them. It is not ESRI’s job to satisfy all the theoretical needs of the spatial sciences.

Categories
Data

What’s New with OSMnx, Part 1

There have been some major changes to OSMnx in the past couple months. I’ll review them briefly here, demonstrate some usage examples, then reflect on a couple upcoming improvements on the horizon. First, what’s new:

  • new consolidate_intersections function with topological option
  • new speed module to impute missing street speeds and calculate travel times for all edges
  • generalized POIs module to query with a flexible tags dict
  • you can now query OSM by date
  • you can now save graph as a geopackage file
  • clean up and streamline the OSMnx API
Categories
Planning

Off the Grid at TRB

I am presenting my ongoing research into the recent evolution of American street network planning and design at the annual meeting of the Transportation Research Board in Washington DC on January 13. This presentation asks the question: how has street network design changed over time, especially in recent years? I analyze the street networks of every US census tract and estimate each’s vintage.

Street network designs grew more disconnected, coarse-grained, and circuitous over the 20th century… but the 21st century has witnessed a promising rebound back toward more traditional, dense, and interconnected grids. Higher griddedness is associated with less car ownership, even when controlling for related socioeconomic, topographical, and other urban factors.

Update: the paper has been published in JAPA.

Categories
Urban

Big Data in Urban Morphology

My new article “Spatial Information and the Legibility of Urban Form: Big Data in Urban Morphology” has been published in the International Journal of Information Management (download free PDF). It builds on recent work by Crooks et al, presenting workflows to integrate data-driven and narrative approaches to urban morphology in today’s era of ubiquitous urban big data. It situates this theoretically in the visual culture of planning to present a visualization-mediated interpretative process of data-driven urban morphology, focusing on transportation infrastructure via OSMnx.

OSMnx: Figure-ground diagrams of one square mile of each street network, from OpenStreetMap, made in Python with matplotlib, geopandas, and NetworkX

Categories
Urban

Urban Street Network Orientation

My new article, Urban Spatial Order: Street Network Orientation, Configuration, and Entropy, has just been published in one of my favorite journals: Applied Network Science (download free PDF). This study explores the spatial signatures of urban evolution and central planning. It examines street network orientation, connectivity, granularity, and entropy in 100 cities around the world using OpenStreetMap data and OSMnx for modeling and visualization:

City street network grid orientations, order, disorder, entropy, rose plot, polar histogram made with Python, OSMnx, OpenStreetMap, matplotlib.

So, who’s got a grid and who doesn’t? Each of the cities above is represented by a polar histogram (aka rose diagram) depicting how its streets orient. Each bar’s direction represents the compass bearings of the streets (in that histogram bin) and its length represents the relative frequency of streets with those bearings. The cities above are in alphabetical order. Here they are again, re-sorted from most-ordered/gridded city (Chicago) to most-disordered (Charlotte):

Categories
Data

New Article in Frontiers in Neurology

I recently teamed up with an international group of public health researchers and spatial analysts to co-author an article, An Introduction to Software Tools, Data, and Services for Geospatial Analysis of Stroke Services, that has been accepted for publication at Frontiers in Neurology (download free PDF).

Hospital catchment basin for stroke services. Spatial analysis in python, geopandas, osmnx.

Categories
Academia

AAG Transactions in GIS Plenary

Manhattan, New York City, New York street network, bearing, orientation from OpenStreetMap mapped with OSMnx and PythonI am giving the Transactions in GIS plenary address at the AAG conference this afternoon. I’ll be reflecting on urban science, spatial networks, and tool-building in academia, focusing on OSMnx. A paper will be forthcoming soon, but in the meantime, for any interested plenary session attendees or other folks, here are a few links to more info and related resources:

Getting started

What is OSMnx? What does it do? Here’s a succinct overview.

The easiest way to get started with street network modeling and analysis in OSMnx is with this docker image and these example/tutorial Jupyter notebooks. The OSMnx software documentation is available here and this journal article introduces it more formally.