My article, Measuring the Complexity of Urban Form and Design, is now in-press for publication at Urban Design International (download free PDF). Cities are complex systems composed of many human agents interacting in physical urban space. This paper develops a typology of measures and indicators for assessing the physical complexity of the built environment at the scale of urban design. It extends quantitative measures from city planning, network science, ecosystems studies, fractal geometry, statistical physics, and information theory to the analysis of urban form and qualitative human experience.
Tag: complexity
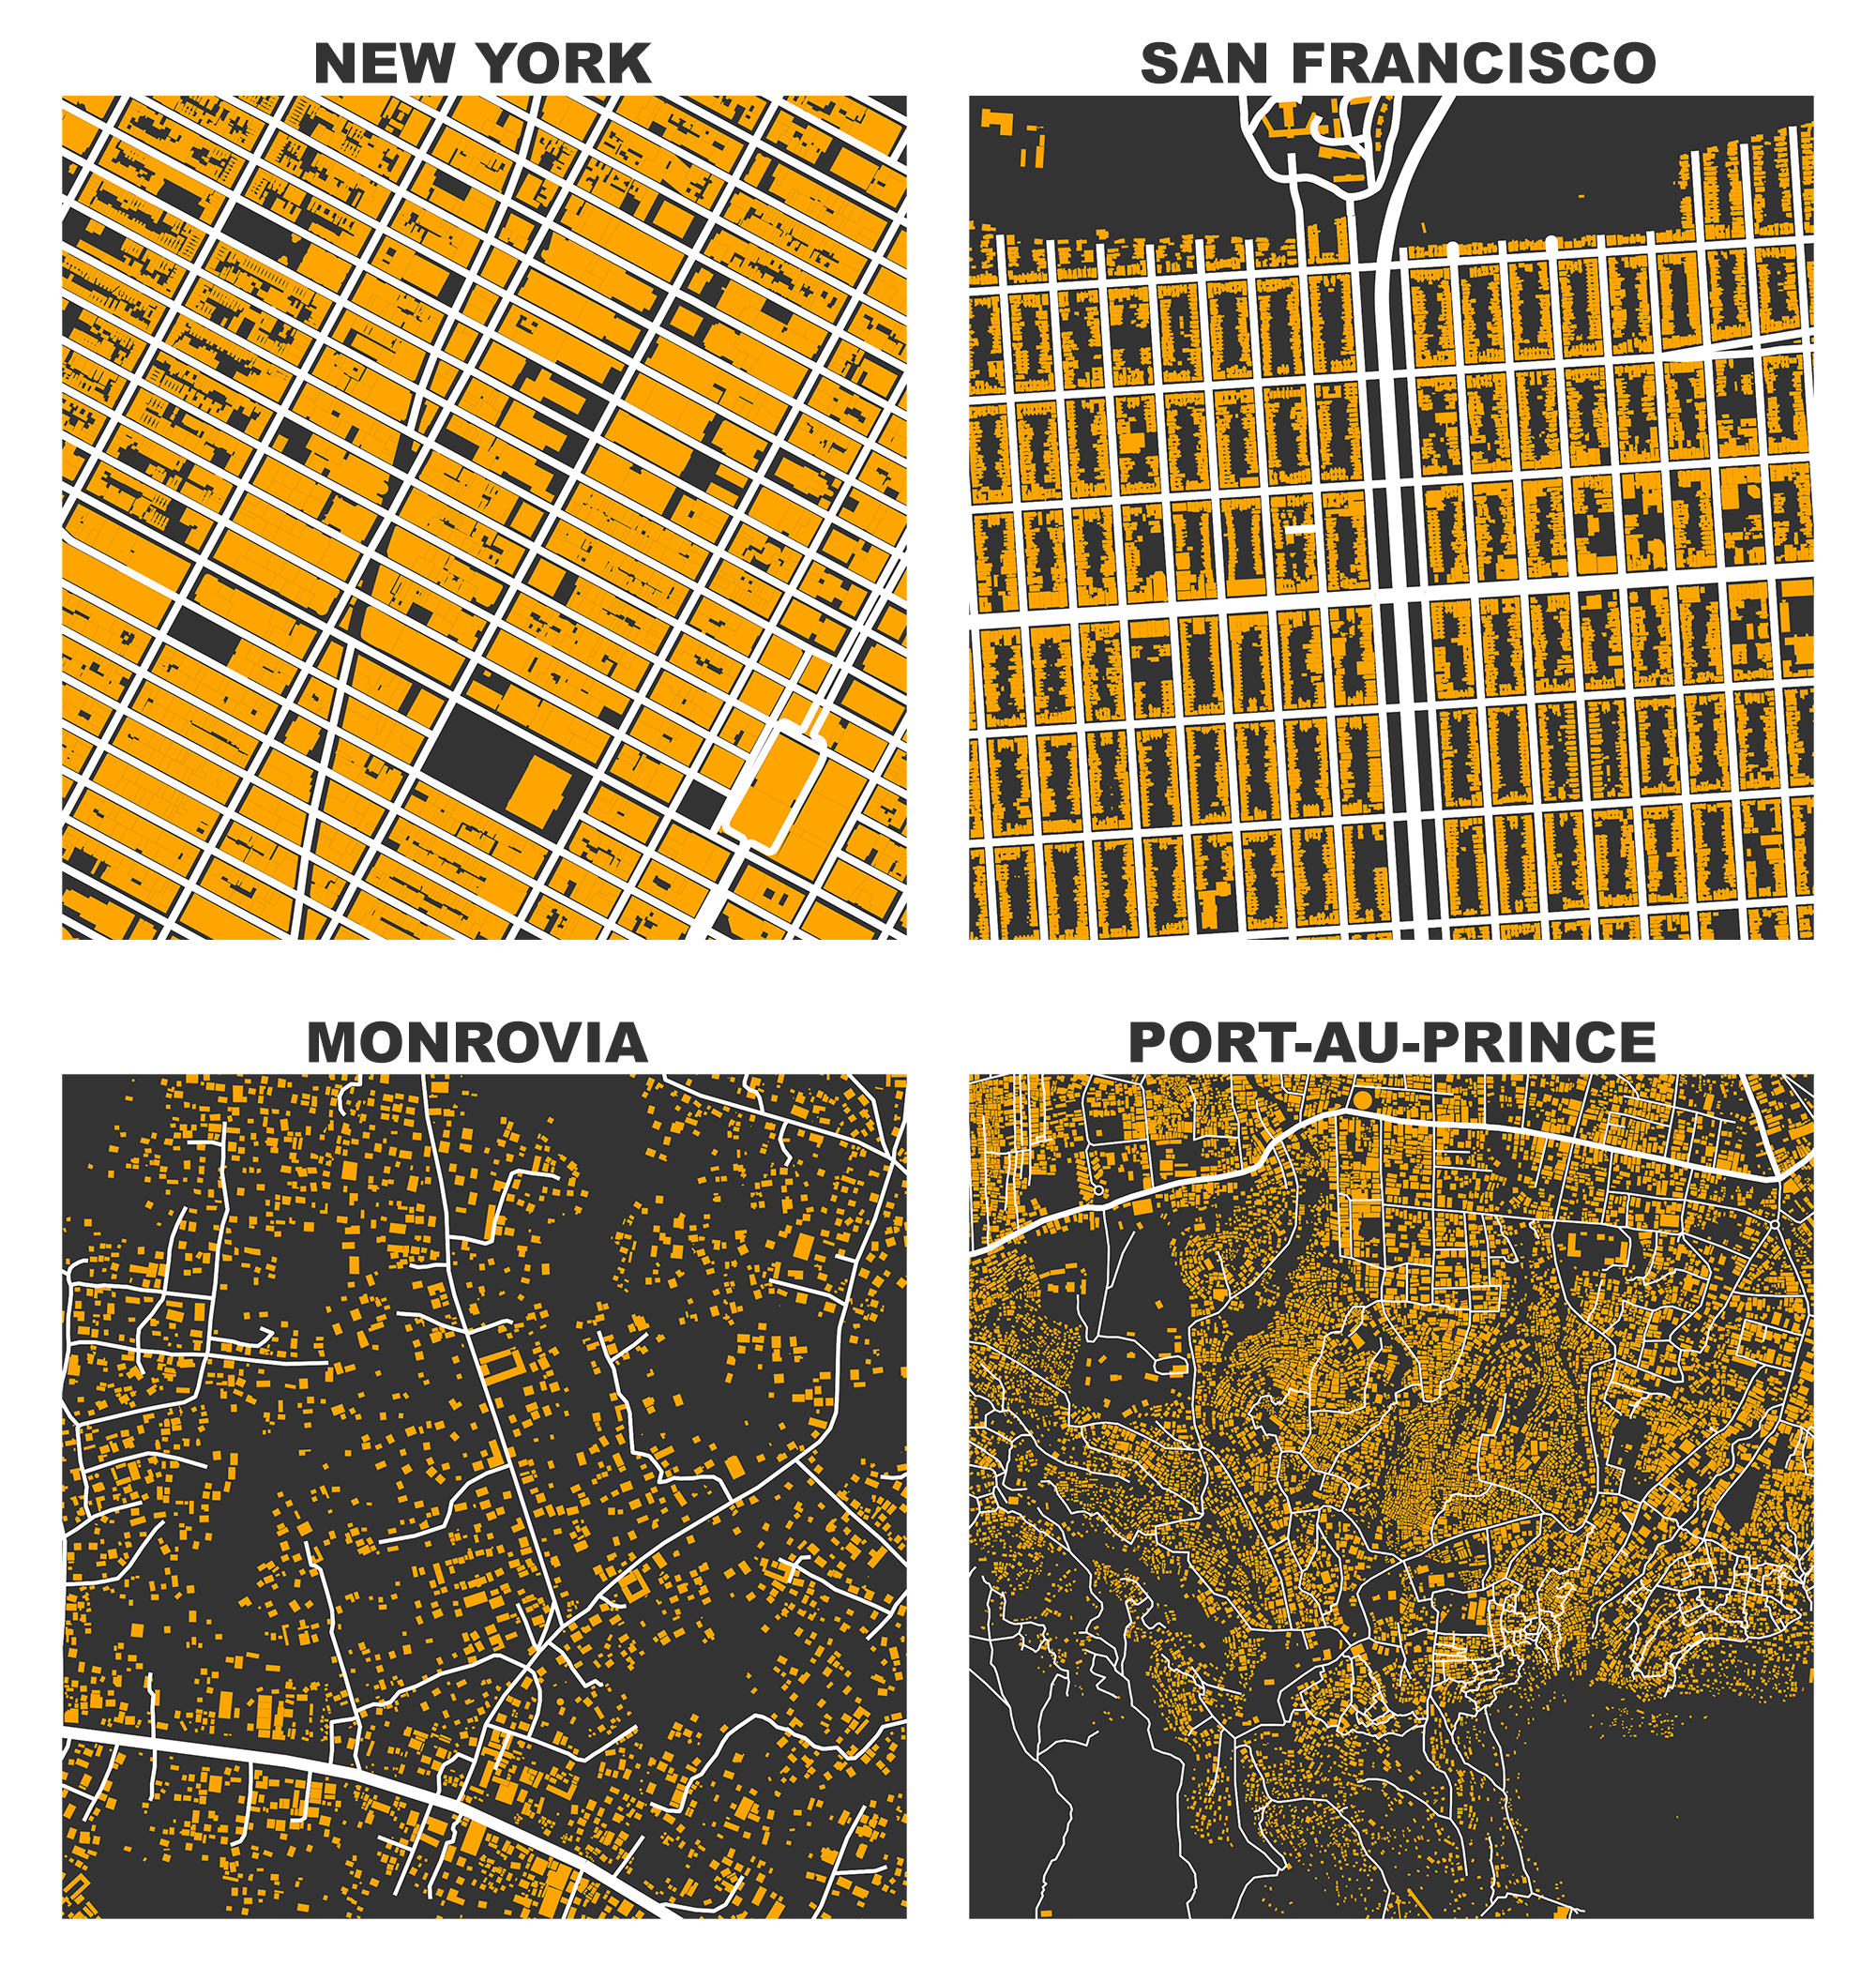
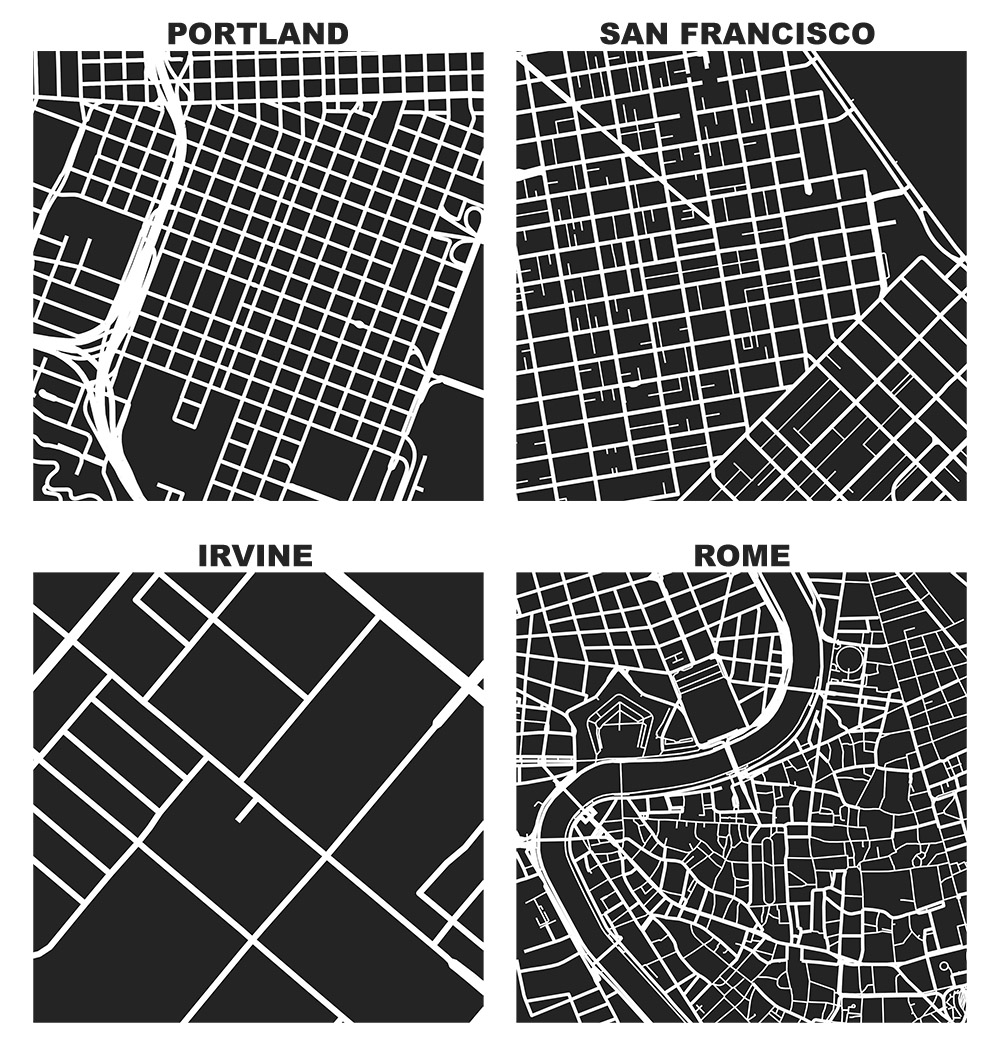
My article, “A Multi-Scale Analysis of 27,000 Urban Street Networks: Every US City, Town, Urbanized Area, and Zillow Neighborhood,” was recently published in Environment and Planning B: Urban Analytics and City Science. This study uses OSMnx to download and analyze 27,000 street networks from OpenStreetMap at metropolitan, municipal, and neighborhood scales – namely, every US city and town, census urbanized area, and Zillow-defined neighborhood. It illustrates the use of OSMnx and OpenStreetMap to consistently conduct street network analysis with extremely large sample sizes, with clearly defined network definitions and extents for reproducibility, and using nonplanar, directed graphs.
These 27,000 street networks as well as their measures have been shared in a free public repository at the Harvard Dataverse for anyone to re-purpose. This study’s empirical findings emphasize measures relevant to graph theory, transportation, urban design, and morphology, such as structure, connectedness, density, centrality, and resilience. It uses graph Maximum Betweenness Centrality and Average Node Connectivity to examine how “resilient” a street network is, in terms of how reliant it is on important nodes and how easy it is to disconnect it.
This post is adapted from this research paper that you can read/cite for more info. It analyzes and visualizes 100 cities around the world.
By popular request, this is a quick follow-up to this post comparing the orientation of streets in 25 US cities using Python and OSMnx. Here are 25 more cities around the world:
Urban Street Network Centrality
Check out the journal article about OSMnx.
We can measure and visualize how “important” a node or an edge is in a network by calculating its centrality. Lots of flavors of centrality exist in network science, including closeness, betweenness, degree, eigenvector, and PageRank. Closeness centrality measures the average shortest path between each node in the network and every other node: more central nodes are closer to all other nodes. We can calculate this easily with OSMnx, as seen in this GitHub demo. For example, here is the node closeness centrality for Piedmont, California:
OSMnx and Street Network Elevation Data
Check out the journal article about OSMnx.
OSMnx can now download street network elevation data for anywhere in the world. In one line of code it downloads the elevation in meters of each network node, and in one more line of code it can calculate every street (i.e., edge) grade. Here is the complete street network of San Francisco, California, with nodes colored according to their elevation:
Urban Form Figure-Ground Diagrams
Check out the journal article about OSMnx.
I previously demonstrated how to create figure-ground square-mile visualizations of urban street networks with OSMnx to consistently compare city patterns, design paradigms, and connectivity. OSMnx downloads, analyzes, and visualizes street networks from OpenStreetMap but it can also get building footprints. If we mash-up these building footprints with the street networks, we get a fascinating comparative window into urban form:
Square-Mile Street Network Visualization
Check out the journal article about OSMnx. All figures in this article come from this journal article, which you can read/cite for more.
The heart of Allan Jacobs’ classic book on street-level urban form and design, Great Streets, features dozens of hand-drawn figure-ground diagrams in the style of Nolli maps. Each depicts one square mile of a city’s street network. Drawing these cities at the same scale provides a revealing spatial objectivity in visually comparing their street networks and urban forms.
We can recreate these visualizations automatically with Python and the OSMnx package, which I developed as part of my dissertation. With OSMnx we can download a street network from OpenStreetMap for anywhere in the world in just one line of code. Here are the square-mile diagrams of Portland, San Francisco, Irvine, and Rome created and plotted automatically by OSMnx:
Animating the Lorenz Attractor with Python
Edward Lorenz, the father of chaos theory, once described chaos as “when the present determines the future, but the approximate present does not approximately determine the future.”
Lorenz first discovered chaos by accident while developing a simple mathematical model of atmospheric convection, using three ordinary differential equations. He found that nearly indistinguishable initial conditions could produce completely divergent outcomes, rendering weather prediction impossible beyond a time horizon of about a fortnight.
OSMnx: Python for Street Networks
If you use OSMnx in your work, please cite the journal article.
OSMnx is a Python package to retrieve, model, analyze, and visualize street networks from OpenStreetMap. Users can download and model walkable, drivable, or bikeable urban networks with a single line of Python code, and then easily analyze and visualize them. You can just as easily download and work with amenities/points of interest, building footprints, elevation data, street bearings/orientations, and network routing. If you use OSMnx in your work, please download/cite the paper here.
In a single line of code, OSMnx lets you download, model, and visualize the street network for, say, Modena Italy:
import osmnx as ox ox.plot_graph(ox.graph_from_place('Modena, Italy'))
Urban Design and Complexity
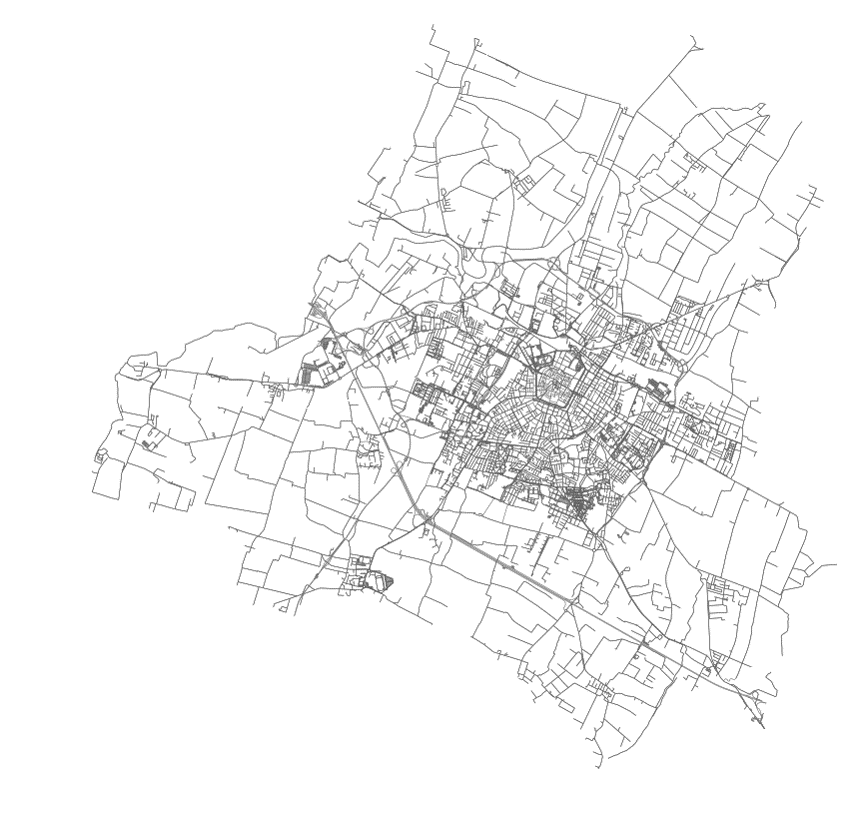
I am presenting at the 2015 Conference on Complex Systems tomorrow in Tempe, Arizona. My paper is on methods for assessing the complexity of urban design. If you’re attending the conference, come on by!
Here’s the paper.
Here’s the abstract: