Categories
Data

Defining Urban Data Science

I’m a co-author on a new article out inĀ Environment and Planning B: Urban Analytics and City Science titled “A Roundtable Discussion: Defining Urban Data Science” (download free PDF). It arises from a panel discussion I participated in at the 2019 AAG Annual Meeting in DC. Vanessa Frias-Martinez, Song Gao, Ate Poorthuis, and Wenfei Xu joined me on the panel, which was organized and moderated by Wei Kang, Taylor Oshan, and Levi Wolf. From the abstract:

Categories
Urban

Urban Street Network Orientation

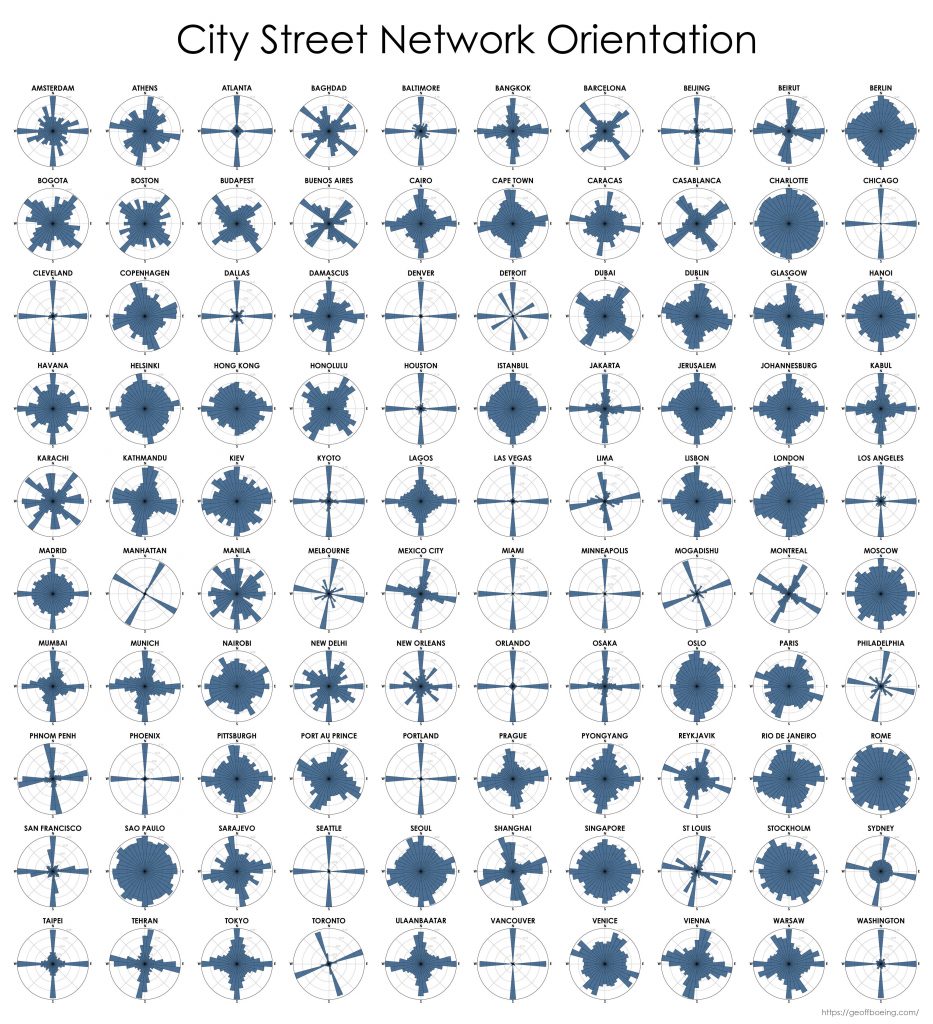
My new article, Urban Spatial Order: Street Network Orientation, Configuration, and Entropy, has just been published in one of my favorite journals: Applied Network Science (download free PDF). This study explores the spatial signatures of urban evolution and central planning. It examines street network orientation, connectivity, granularity, and entropy in 100 cities around the world using OpenStreetMap data and OSMnx for modeling and visualization:

City street network grid orientations, order, disorder, entropy, rose plot, polar histogram made with Python, OSMnx, OpenStreetMap, matplotlib.

So, who’s got a grid and who doesn’t? Each of the cities above is represented by a polar histogram (aka rose diagram) depicting how its streets orient. Each bar’s direction represents the compass bearings of the streets (in that histogram bin) and its length represents the relative frequency of streets with those bearings. The cities above are in alphabetical order. Here they are again, re-sorted from most-ordered/gridded city (Chicago) to most-disordered (Charlotte):

Categories
Academia

AAG Transactions in GIS Plenary

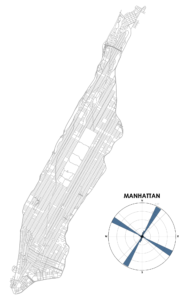
Manhattan, New York City, New York street network, bearing, orientation from OpenStreetMap mapped with OSMnx and PythonI am giving the Transactions in GIS plenary address at the AAG conference this afternoon. I’ll be reflecting on urban science, spatial networks, and tool-building in academia, focusing on OSMnx. A paper will be forthcoming soon, but in the meantime, for any interested plenary session attendees or other folks, here are a few links to more info and related resources:

Getting started

What is OSMnx? What does it do? Here’s a succinct overview.

The easiest way to get started with street network modeling and analysis in OSMnx is with this docker image and these example/tutorial Jupyter notebooks. The OSMnx software documentation is available here and this journal article introduces it more formally.

Categories
Planning

Comparing US City Street Orientations

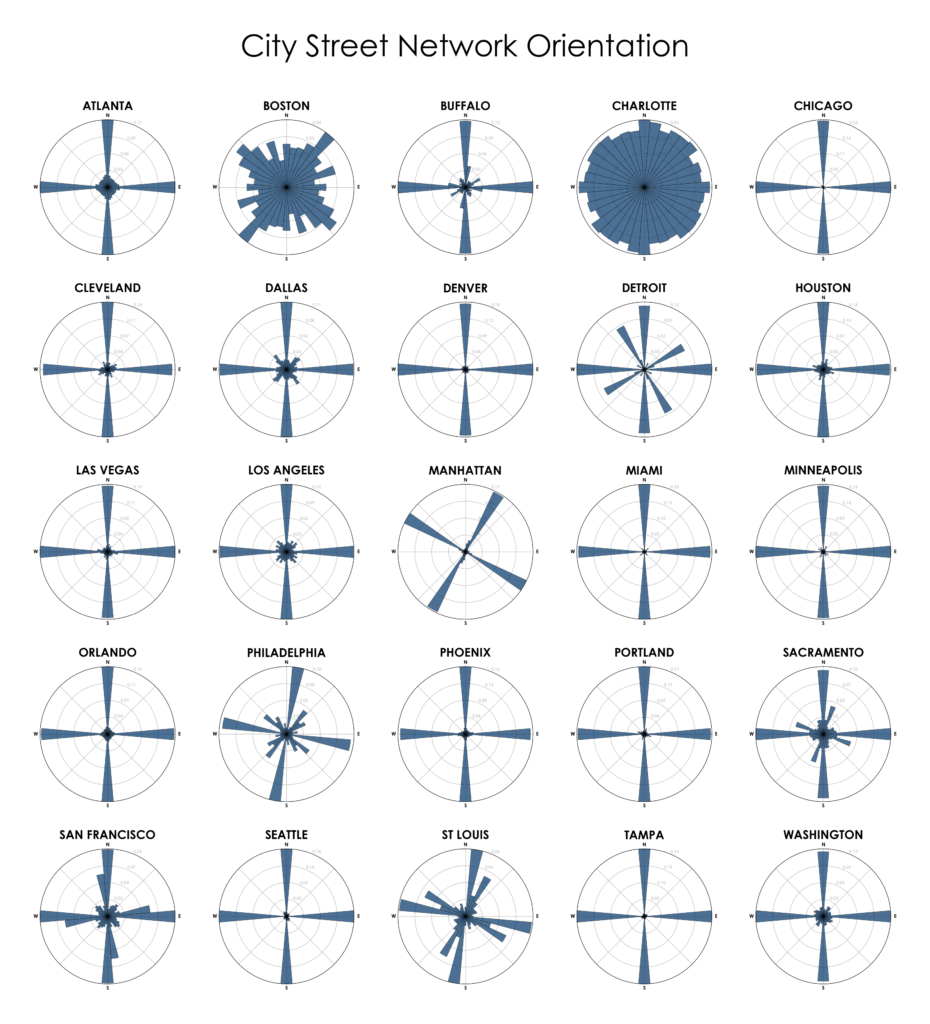
City street network grid orientations, order, disorder, entropy, rose plot, polar histogram made with Python, OSMnx, OpenStreetMap, matplotlib.This post is adapted from this research paperĀ that you can read/cite for more info. It analyzes and visualizes 100 cities around the world.

“We say the cows laid out Boston. Well, there are worse surveyors.” ā€“Ralph Waldo Emerson. In 1960, one hundred years after Emerson’s quote, Kevin Lynch published The Image of the City, his treatise on the legibility of urban patterns. How coherent is a city’s spatial organization? How do these patterns help or hinder urban navigation? I recently wrote about visualizing street orientationsĀ withĀ Python andĀ OSMnx. That is, how is a city’s streetĀ network orientedĀ in terms of the streets’ compass bearings? How well does it adhere to a straightforward north-south-east-west layout? I wanted to revisit this by comparing 25 major US cities’ orientations (EDIT: by popular request, see also thisĀ follow-up comparing world cities):

City street network grid orientations, rose plot, polar histogram made with Python, OSMnx, OpenStreetMap, matplotlib. Atlanta, Boston, Buffalo, Charlotte, Chicago, Cleveland, Dallas, Denver, Detroit, Houston, Las Vegas, Los Angeles, Manhattan, New York, Miami, Minneapolis, Orlando, Philadelphia, Phoenix, Portland, Sacramento, San Francisco, Seattle, St Louis, Tampa, Washington DC.