Categories
Data

OSMnx 2.0 Released

OSMnx version 2.0.0 has been released. This has been a massive effort over the past year to streamline the package’s API, re-think its internal organization, and optimize its code. Today OSMnx is faster, more memory efficient, and fully type-annotated for a better user experience.

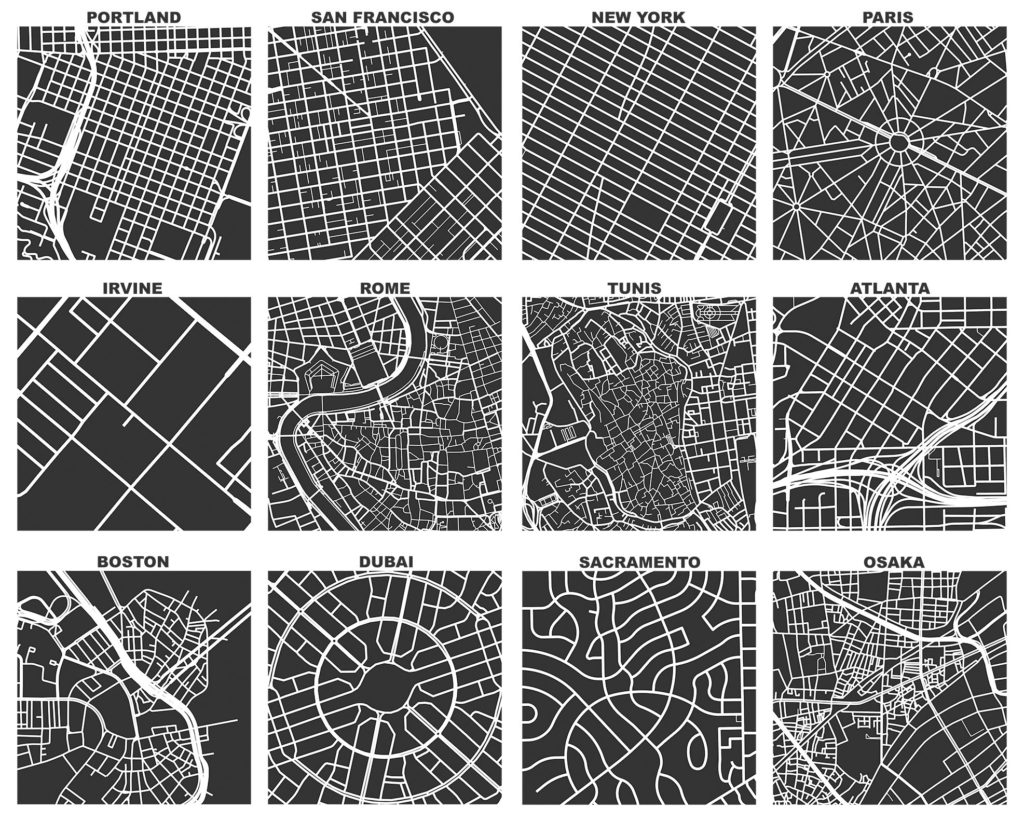
If you haven’t used it before, OSMnx is a Python package to easily download, model, analyze, and visualize street networks and any other geospatial features from OpenStreetMap. You can download and model walking, driving, or biking networks with a single line of code then quickly analyze and visualize them. You can just as easily work with urban amenities/points of interest, building footprints, transit stops, elevation data, street orientations, speed/travel time, and routing.OSMnx: Figure-ground diagrams of one square mile of each street network, from OpenStreetMap, made in Python with matplotlib, geopandas, and NetworkXThis has now been a labor of love for me for about 9 years. Wow. I initially developed this package to enable the empirical research for my dissertation. Since then, it has powered probably 2/3 of the articles I’ve published over the years. And it has received hundreds of contributions from many other code contributors. Thank you to everyone who helped make this possible.

I hope you find the package as useful as I do. Now I’m looking forward to all of your bug reports.

Categories
Planning

Framework for Measuring Pedestrian Accessibility

I’m a co-author of a new article, “A Generalized Framework for Measuring Pedestrian Accessibility around the World Using Open Data,” which has just been published by Geographical Analysis. We developed an open source, containerized software framework for modeling pedestrian networks using open data to analyze disaggregate access to daily living needs. We worked with local partners in 25 cities around the world to demonstrate and validate this toolkit.

From the abstract:

Pedestrian accessibility is an important factor in urban transport and land use policy and critical for creating healthy, sustainable cities. Developing and evaluating indicators measuring inequalities in pedestrian accessibility can help planners and policymakers benchmark and monitor the progress of city planning interventions. However, measuring and assessing indicators of urban design and transport features at high resolution worldwide to enable city comparisons is challenging due to limited availability of official, high quality, and comparable spatial data, as well as spatial analysis tools offering customizable frameworks for indicator construction and analysis. To address these challenges, this study develops an open source software framework to construct pedestrian accessibility indicators for cities using open and consistent data. It presents a generalized method to consistently measure pedestrian accessibility at high resolution and spatially aggregated scale, to allow for both within- and between-city analyses. The open source and open data methods developed in this study can be extended to other cities worldwide to support local planning and policymaking. The software is made publicly available for reuse in an open repository.

For more, check out the article.

Categories
Planning

Robert Moses Responds to Robert Caro

In 1974, Robert Caro published The Power Broker, a critical biography of Robert Moses’s dictatorial tenure as the “master builder” of mid-century New York. Moses profoundly transformed New York’s urban fabric and transportation system, producing the Brooklyn Battery Tunnel, the Verrazano Narrows Bridge, the Westside Highway, the Cross-Bronx Expressway, the Lincoln Center, the UN headquarters, Shea Stadium, Jones Beach State Park and many other projects. However, The Power Broker did lasting damage to his public image and today he remains one of the most controversial figures in city planning history.

Today, The Power Broker may be the most well-known biography of any urban planner ever. Less-known: on August 26, 1974, Moses issued a turgid 23-page statement denouncing Caro’s work as “full of mistakes, unsupported charges, nasty baseless personalities, and random haymakers.” Moses’s original typewritten statement survives today as a grainy photocopy in the New York City Parks Department archive. To better preserve and disseminate it, I extracted and transcribed its text using optical character recognition and edited the result to correct errors. My transcription of Moses’s statement, alongside Caro’s response to it, is available here.

Categories
Data

Worldwide Street Network Models and Indicators

My article, “Street Network Models and Indicators for Every Urban Area in the World” has been published by Geographical Analysis. This project was a massive undertaking and I’m excited to share it. As you might guess from the title, I modeled and analyzed the street network of each urban area in the world then deposited all the source code and models and indicators in open repositories for public reuse. The article also includes a high-level analysis of urban street network form across the world.

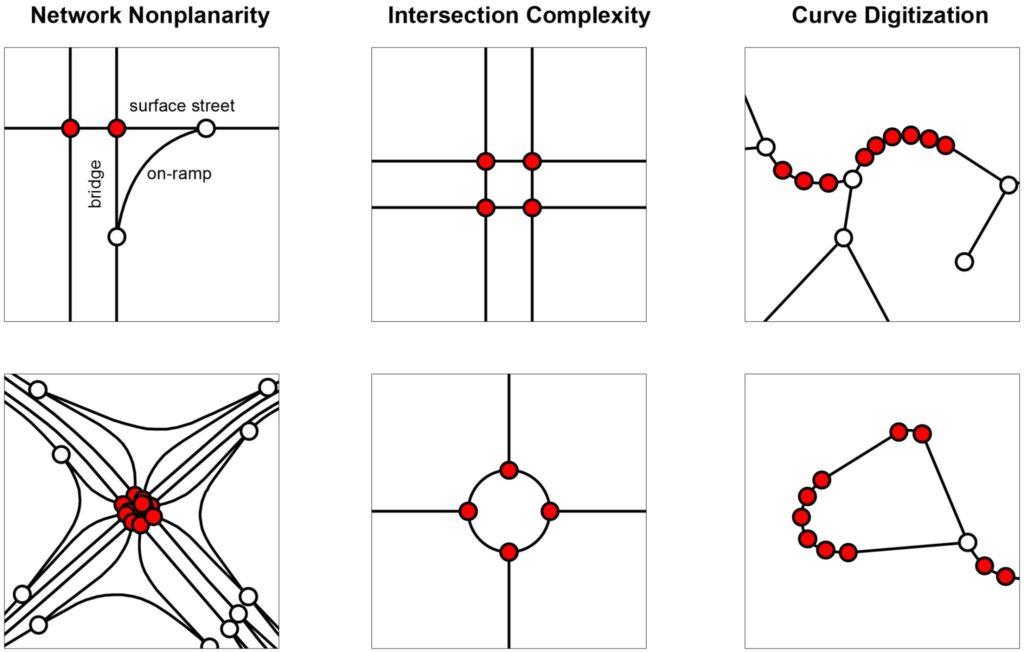
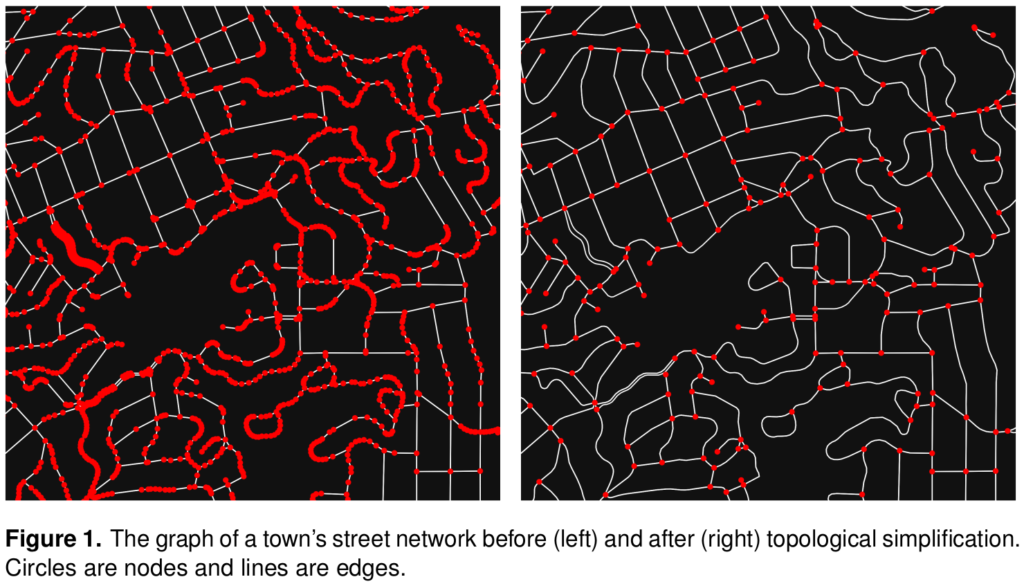
Cities worldwide exhibit a variety of street patterns and configurations that shape human mobility, equity, health, and livelihoods. Using boundaries derived from the Global Human Settlement Layer, I modeled and analyzed the street networks of every urban area in the world using OSMnx and OpenStreetMap raw data. In total, I modeled over 160 million street network nodes and over 320 million edges across 8,914 urban areas in 178 countries. I attached node elevations and street grades to every node/edge in the final models. All the final models were topologically simplified such that nodes represent intersections and dead-ends, and edges represent the street segments linking them.

Street network topology simplification with OSMnx and OpenStreetMap

Categories
Data

OSMnx Summer Wrap-Up

OSMnx underwent a major overhaul this summer, with the development of several new features, improvements, and optimizations. This project concluded yesterday with the release of v0.16.0.

This post briefly summarizes what’s changed since the previous mid-summer updates. It covers the new k shortest paths solver, auto-selecting the first polygon when geocoding, better conversion of graph types, and the new geometries module that lets you flexibly download any OSM geospatial objects as a geopandas GeoDataFrame.

Categories
Data

New Article on Computational Notebooks

I have a new article out in Region: Journal of the European Regional Science Association, “Urban Street Network Analysis in a Computational Notebook.” It reflects on the use of Jupyter notebooks in applied data science research, pedagogy, and practice, and it uses the OSMnx examples repository as an example.

From the abstract:

Computational notebooks offer researchers, practitioners, students, and educators the ability to interactively conduct analytics and disseminate reproducible workflows that weave together code, visuals, and narratives. This article explores the potential of computational notebooks in urban analytics and planning, demonstrating their utility through a case study of OSMnx and its tutorials repository. OSMnx is a Python package for working with OpenStreetMap data and modeling, analyzing, and visualizing street networks anywhere in the world. Its official demos and tutorials are distributed as open-source Jupyter notebooks on GitHub. This article showcases this resource by documenting the repository and demonstrating OSMnx interactively through a synoptic tutorial adapted from the repository. It illustrates how to download urban data and model street networks for various study sites, compute network indicators, visualize street centrality, calculate routes, and work with other spatial data such as building footprints and points of interest. Computational notebooks help introduce methods to new users and help researchers reach broader audiences interested in learning from, adapting, and remixing their work. Due to their utility and versatility, the ongoing adoption of computational notebooks in urban planning, analytics, and related geocomputation disciplines should continue into the future.

For more, check out the article.

Categories
Urban

Housing Search in the Age of Big Data

My article “Housing Search in the Age of Big Data: Smarter Cities or the Same Old Blind Spots?” with Max Besbris, Ariela Schachter, and John Kuk is now published in Housing Policy Debate. We look at the quantity and quality of information in online housing listings and find that they are much higher in White and non-poor neighborhoods than they are in poor, Black, or Latino neighborhoods. Listings in White neighborhoods include more descriptive text and focus on unit and neighborhood amenities, while listings in Black neighborhoods focus more on applicant (dis)qualifications. We discuss what this means for housing markets, filter bubbles, residential sorting and segregation, and housing policy. You can download a free PDF.

Housing search technologies are changing and, as a result, so are housing search behaviors. The most recent American Housing Survey revealed that, for the first time, more urban renters found their current homes through online technology platforms than any other information channel. These technology platforms collect and disseminate user-generated content and construct a virtual agora for users to share information with one another. Because they can provide real-time data about various urban phenomena, housing technology platforms are a key component of the smart cities paradigm.

This paradigm promotes information technology as both a technocratic mode of monitoring cities and a utopian mode of improving urban life through big data. In this context, “big data” typically refers to massive streams of user-generated content resulting from millions or billions of decentralized human actions. Data exhaust from Craigslist and other housing technology platforms offers a good example: optimistically, large corpora of rental listings could provide housing researchers and practitioners with actionable insights for policymaking while also equalizing access to information for otherwise disadvantaged homeseekers. But how good are these platforms at resolving the types of problems that already plague old-fashioned, non-big data? Does this broadcasting of information reduce longstanding geographic and demographic inequalities or do established patterns of segmentation and sorting remain?