My chapter “Exploring Urban Form Through OpenStreetMap Data: A Visual Introduction” has just been published in the new book Urban Experience and Design: Contemporary Perspectives on Improving the Public Realm edited by Justin Hollander and Ann Sussman.
From the abstract:
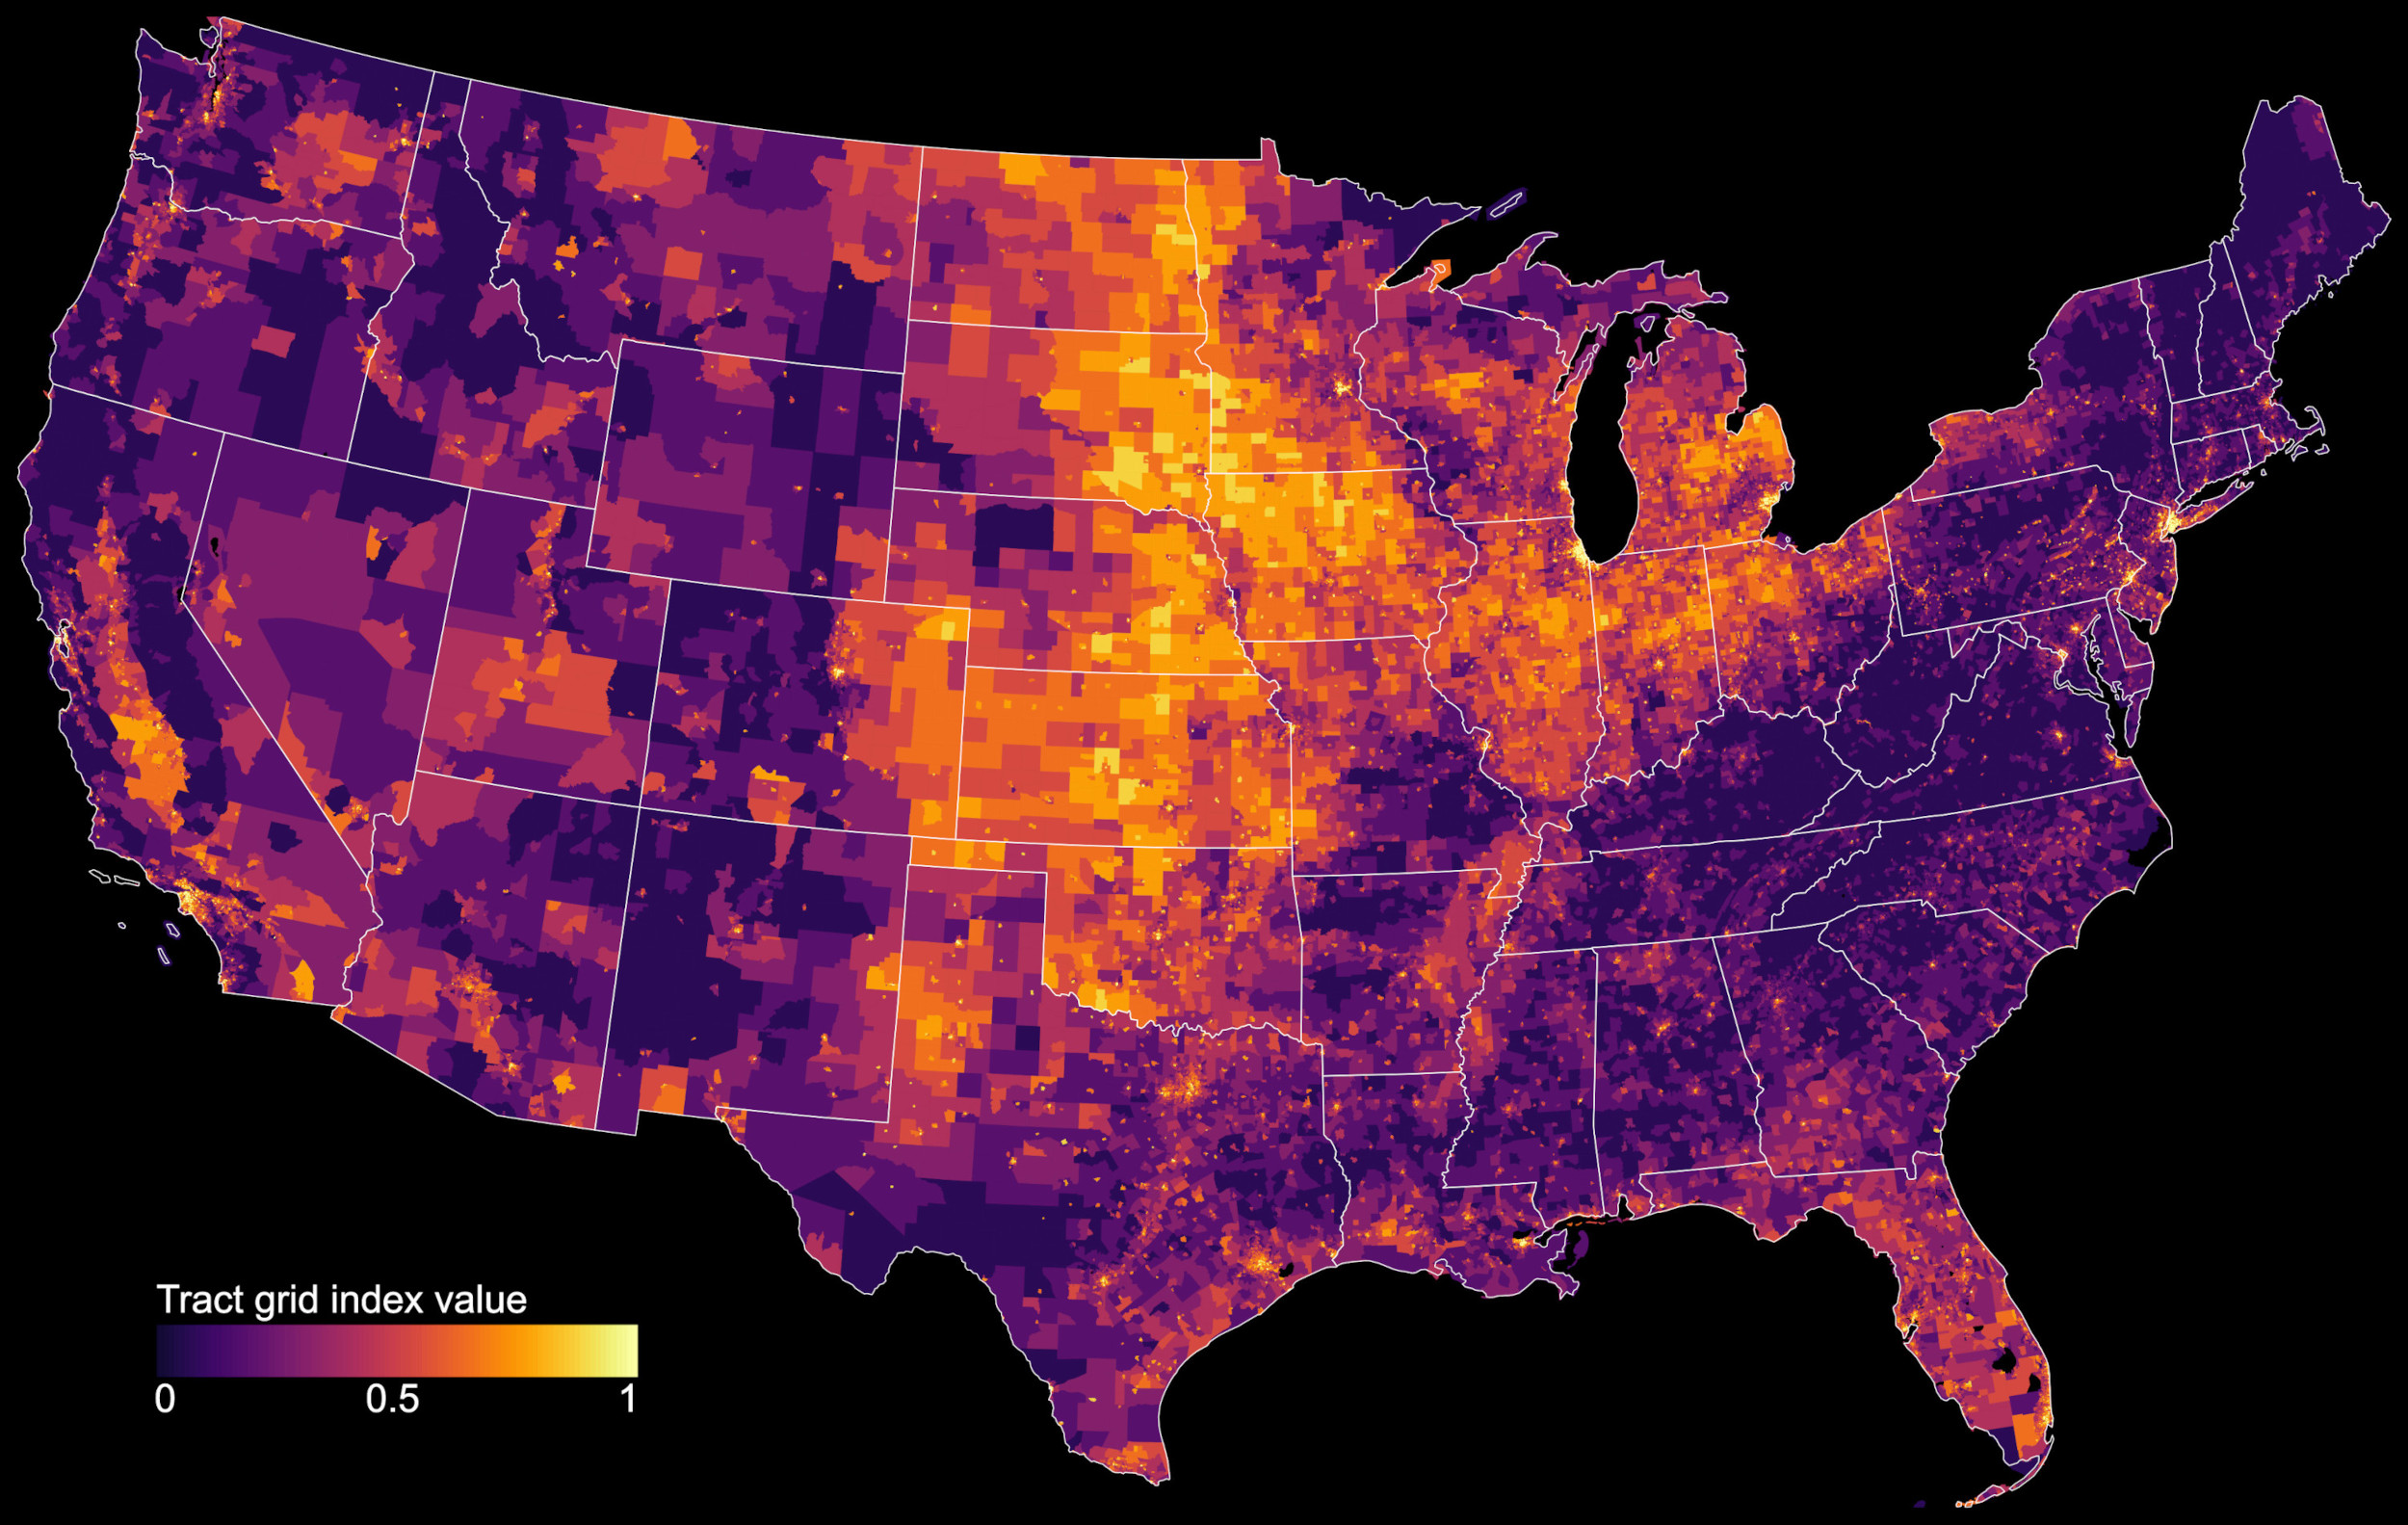
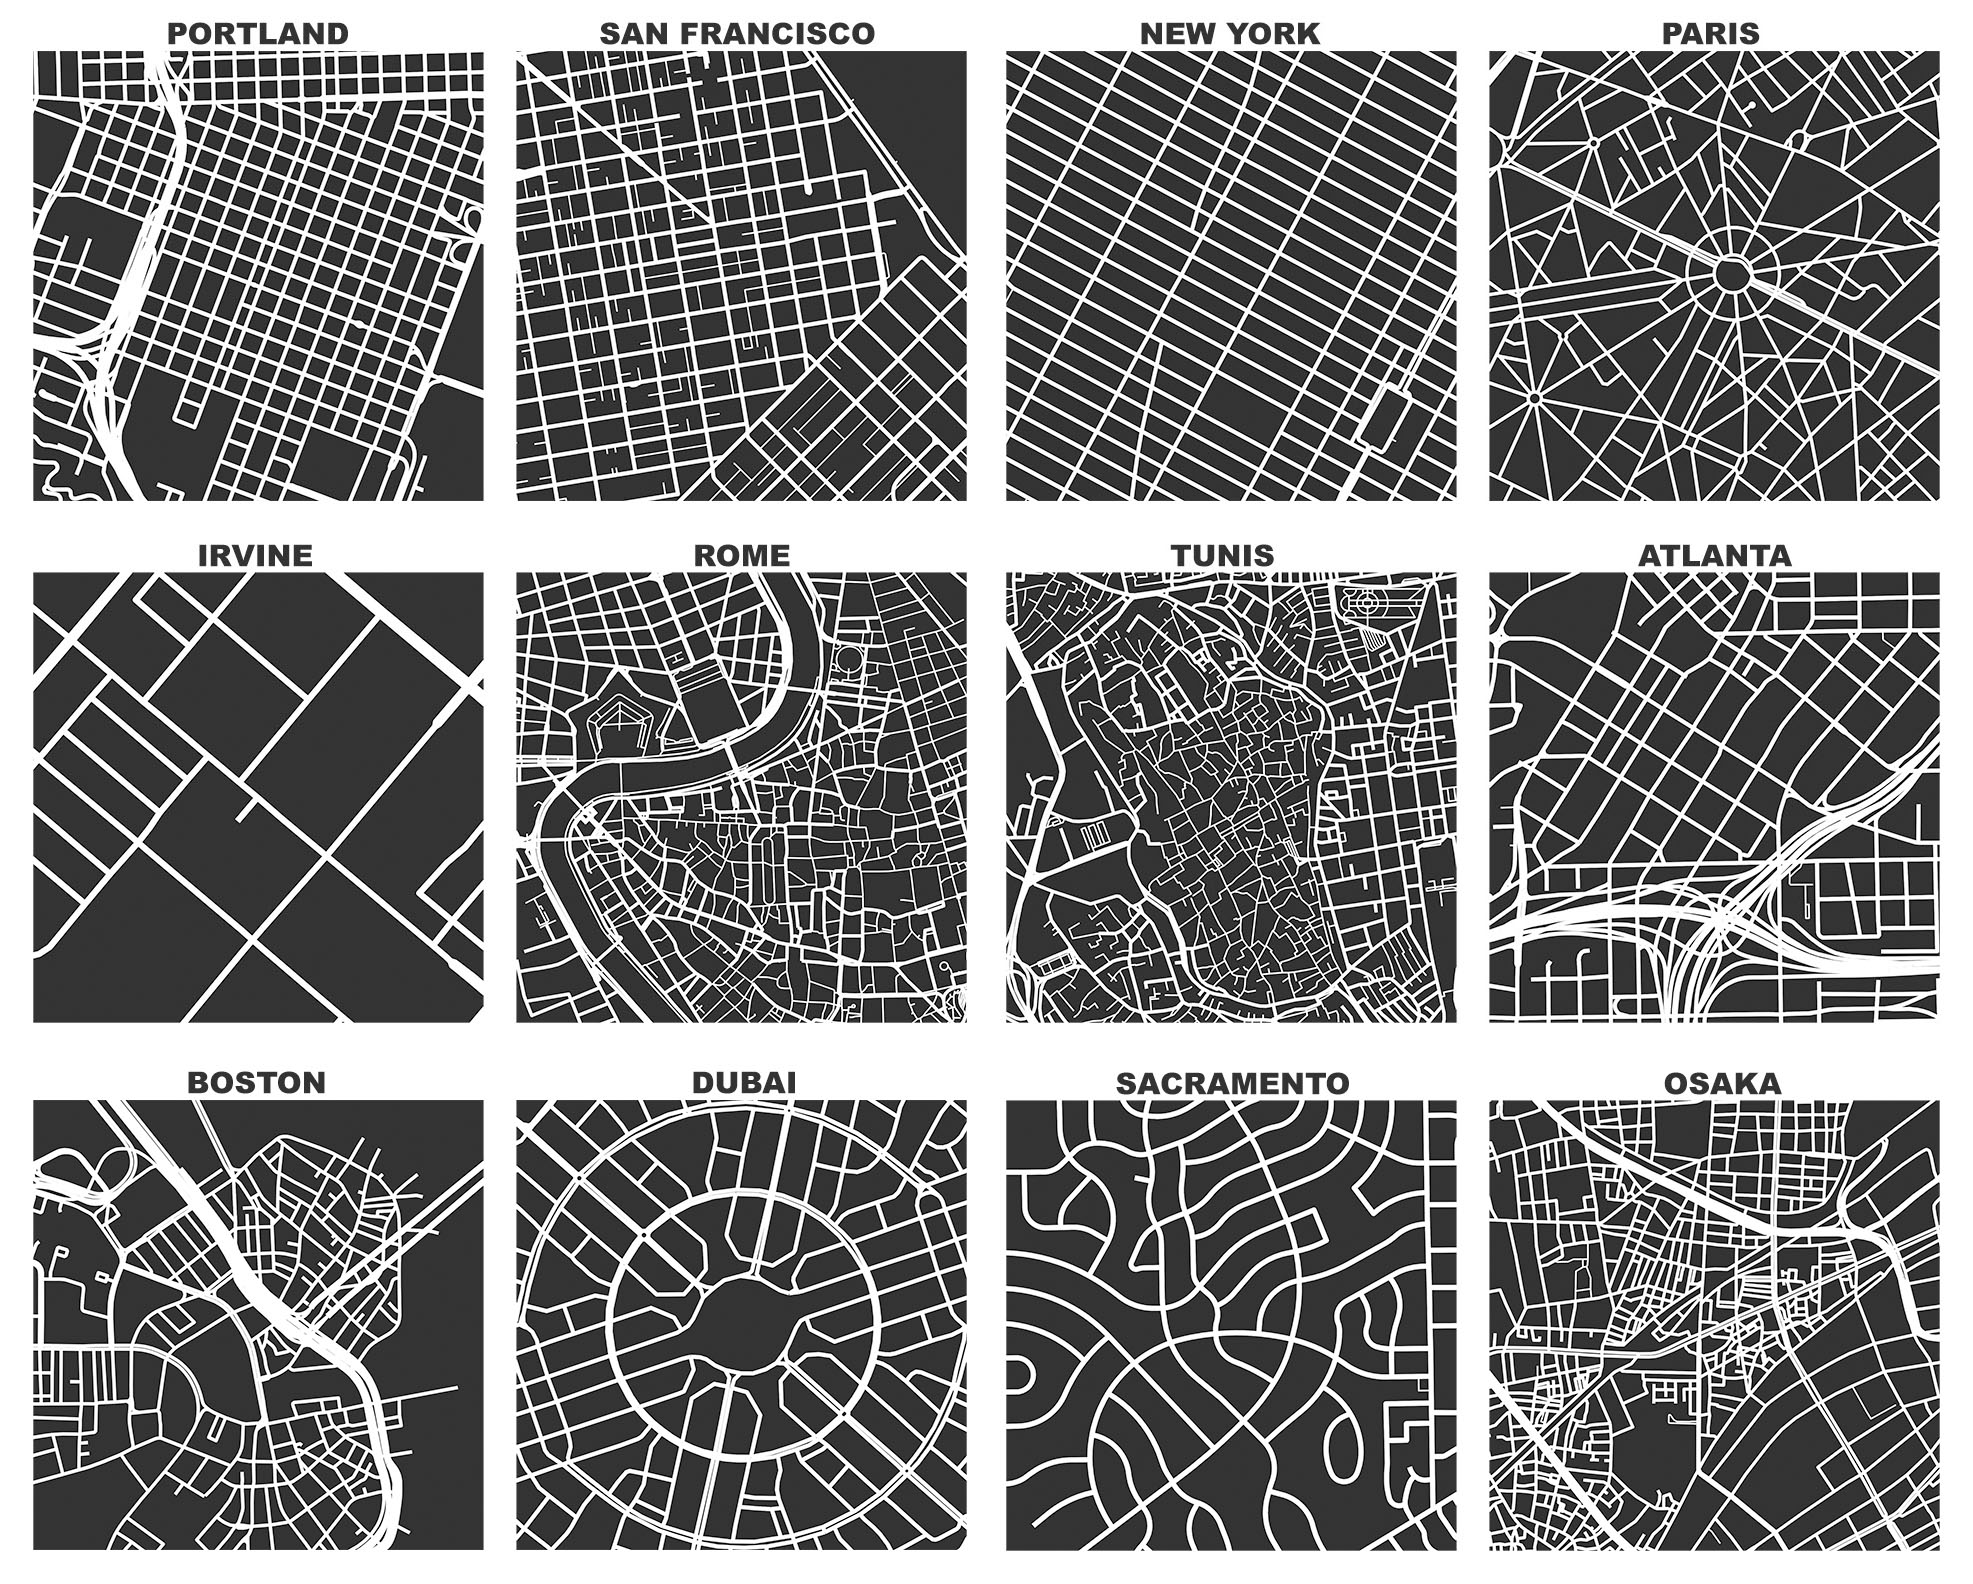
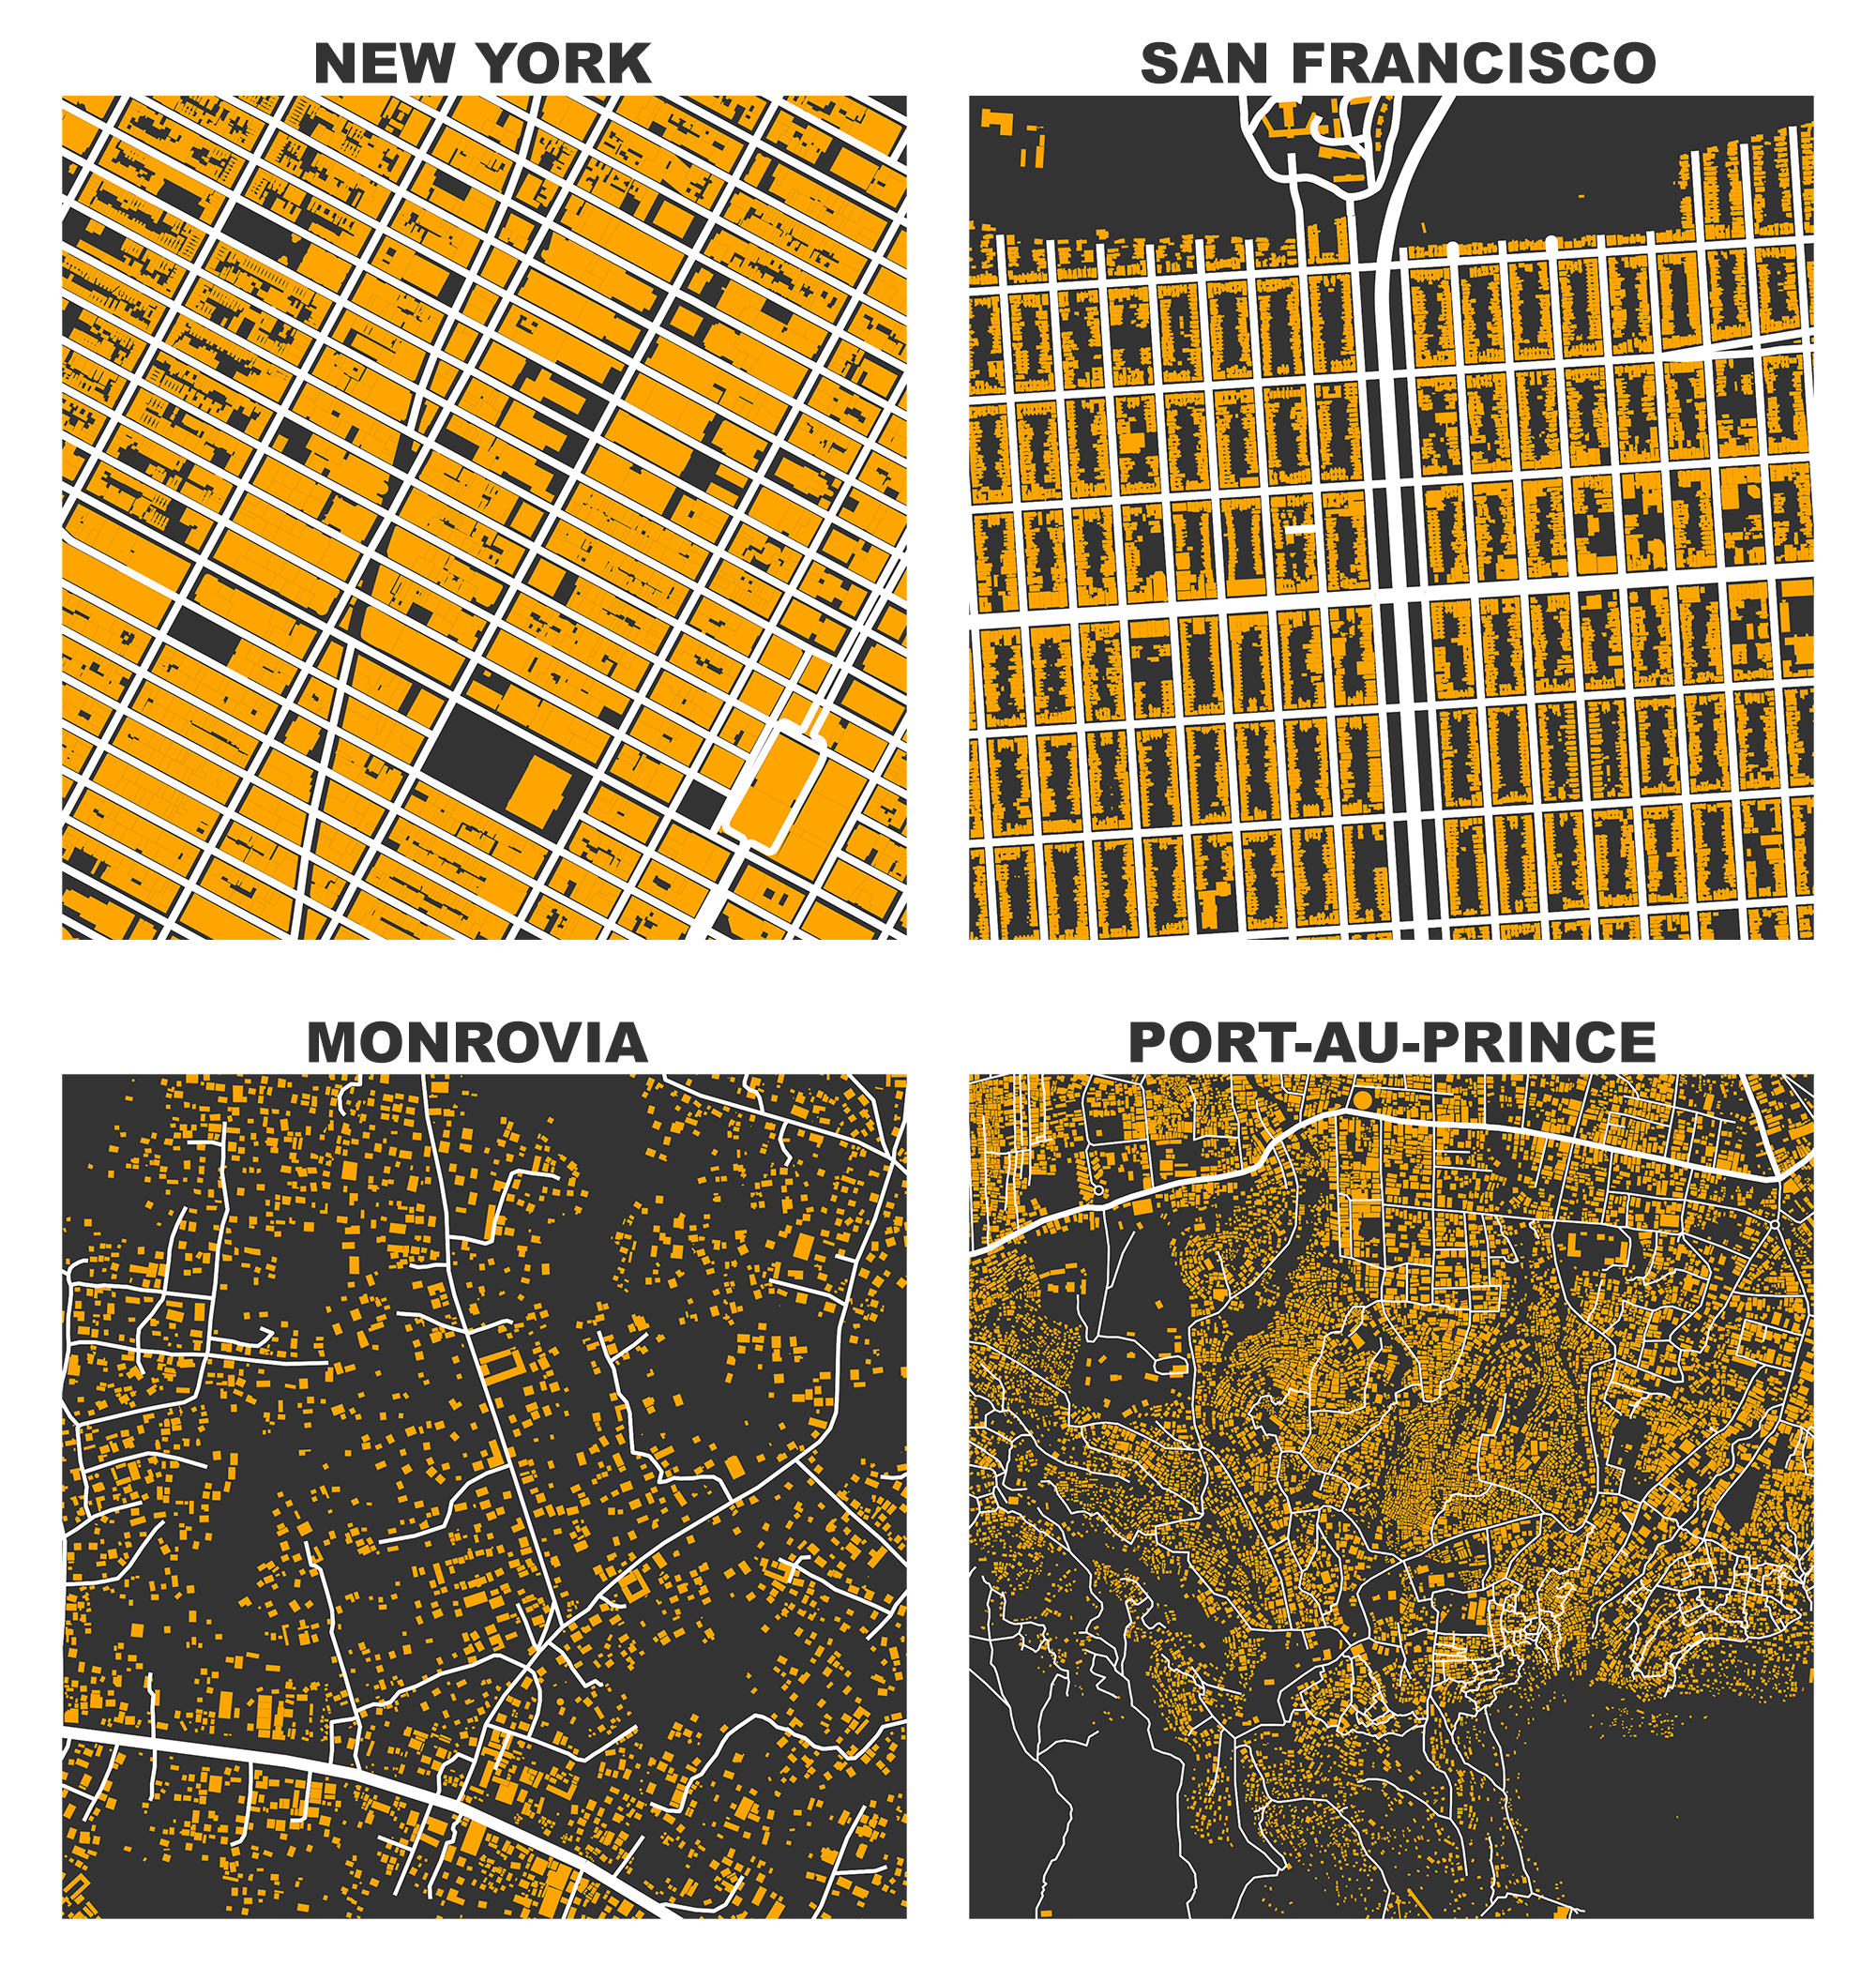
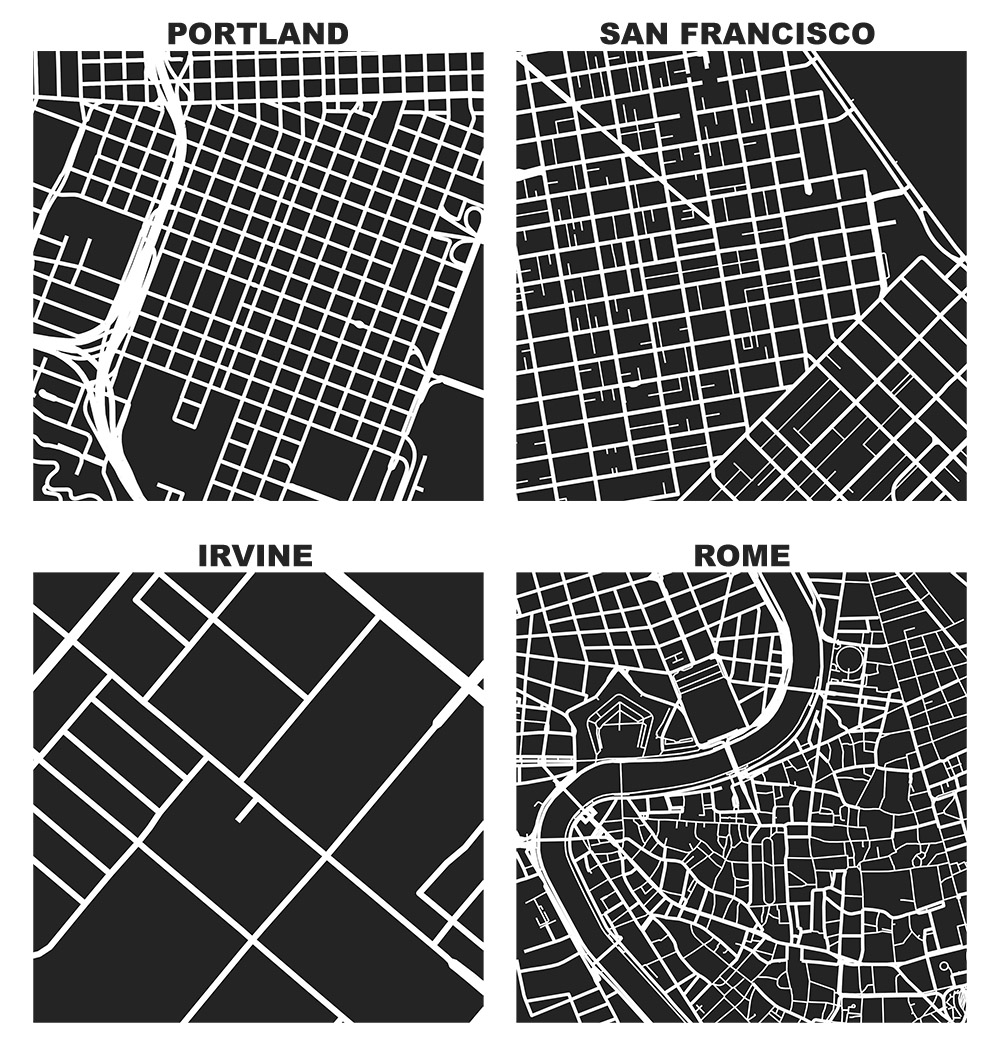
This chapter introduces OpenStreetMap—a crowdsourced, worldwide mapping project and geospatial data repository—to illustrate its usefulness in quickly and easily analyzing and visualizing planning and design outcomes in the built environment. It demonstrates the OSMnx toolkit for automatically downloading, modeling and visualizing spatial data from OpenStreetMap. We explore patterns and configurations in street networks and buildings around the world computationally through visualization methods—including figure-ground diagrams and polar histograms—that help compress urban complexity into comprehensible artifacts that reflect the human experience of the built environment. Ubiquitous urban data and computation can open up new urban form analyses from both quantitative and qualitative perspectives.
For more, check out the chapter.