Categories
Urban

Big Data in Urban Morphology

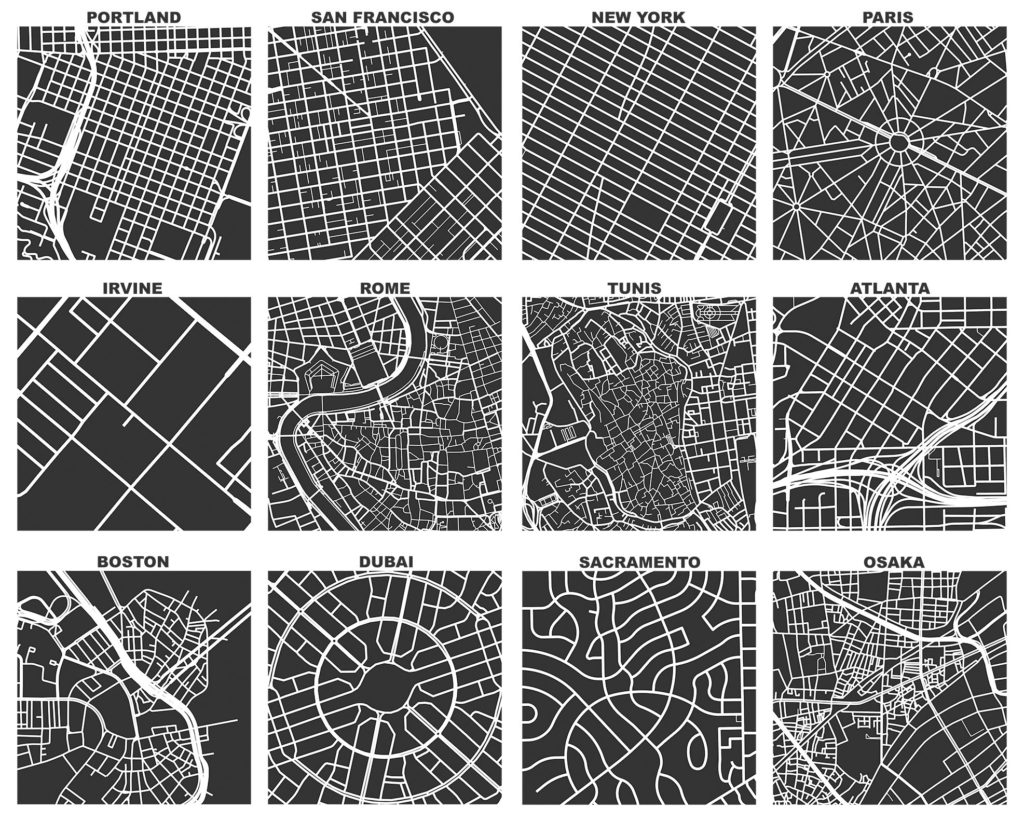
My new article “Spatial Information and the Legibility of Urban Form: Big Data in Urban Morphology” has been published in the International Journal of Information Management (download free PDF). It builds on recent work by Crooks et al, presenting workflows to integrate data-driven and narrative approaches to urban morphology in today’s era of ubiquitous urban big data. It situates this theoretically in the visual culture of planning to present a visualization-mediated interpretative process of data-driven urban morphology, focusing on transportation infrastructure via OSMnx.

OSMnx: Figure-ground diagrams of one square mile of each street network, from OpenStreetMap, made in Python with matplotlib, geopandas, and NetworkX

Categories
Planning

New Article: Planar Models of Street Networks

My article, “Planarity and Street Network Representation in Urban Form Analysis,” was recently published in Environment and Planning B: Urban Analytics and City Science. Models of street networks underlie research in urban travel behavior, accessibility, design patterns, and morphology. These models are commonly defined as planar, meaning they can be represented in two dimensions without any underpasses or overpasses. However, real-world urban street networks exist in three-dimensional space and frequently feature grade separation such as bridges and tunnels: planar simplifications can be useful but they also impact the results of real-world street network analysis. This study measures the nonplanarity of drivable and walkable street networks in the centers of 50 cities worldwide, then examines the variation of nonplanarity across a single city. While some street networks are approximately planar, I empirically quantify how planar models can inconsistently but drastically misrepresent intersection density, street lengths, routing, and connectivity.

Categories
Planning

Isochrone Maps with OSMnx + Python

Check out the journal article about OSMnx.

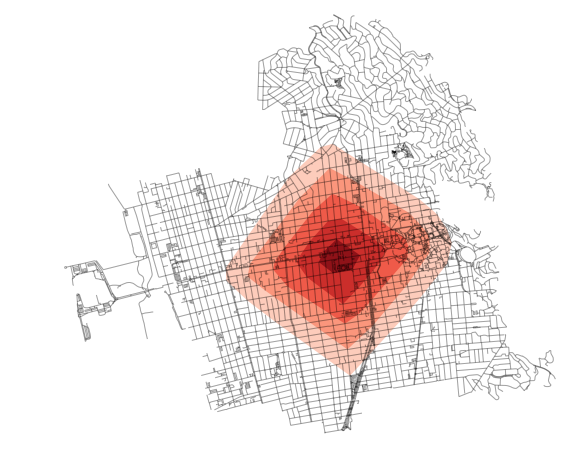
How far can you travel on foot in 15 minutes? Urban planners use isochrone maps to show spatial horizons (i.e., isolines) that are equal in time. Isochrones depict areas according to how long it takes to arrive there from some point. These visualizations are particularly useful in transportation planning as they reveal what places are accessible within a set of time horizons.

We can create isochrone maps for anywhere in the world automatically with Python and its OSMnx package:

OSMnx map of isochrone isolines in Berkeley California's street network

Categories
Data

OSMnx and Street Network Elevation Data

Check out the journal article about OSMnx.

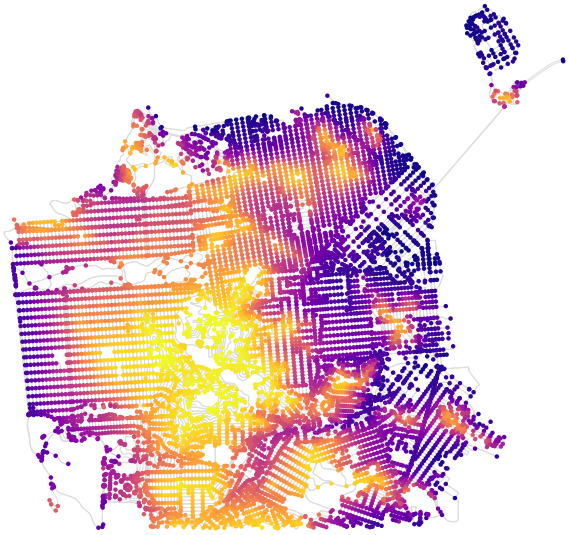
OSMnx can now download street network elevation data for anywhere in the world. In one line of code it downloads the elevation in meters of each network node, and in one more line of code it can calculate every street (i.e., edge) grade. Here is the complete street network of San Francisco, California, with nodes colored according to their elevation:

OSMnx street network elevation data for San Francisco, California to calculate street grade and steepness

Categories
Planning

Urban Form Analysis with OpenStreetMap Data

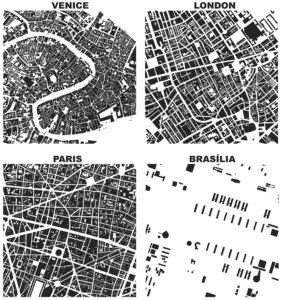
Figure-ground diagrams of urban form and building footprints in London, Paris, Venice, and Brasilia depict modernism's inversion of traditional spatial orderCheck out the journal article about OSMnx. This is a summary of some of my recent research on making OpenStreetMap data analysis easy for urban planners. It was also published on the ACSP blog.

OpenStreetMap – a collaborative worldwide mapping project inspired by Wikipedia – has emerged in recent years as a major player both for mapping and acquiring urban spatial data. Though coverage varies somewhat worldwide, its data are of high quality and compare favorably to CIA World Factbook estimates and US Census TIGER/Line data. OpenStreetMap imported the TIGER/Line roads in 2007 and since then its community has made numerous corrections and improvements. In fact, many of these additions go beyond TIGER/Line’s scope, including for example passageways between buildings, footpaths through parks, bike routes, and detailed feature attributes such as finer-grained street classifiers, speed limits, etc.

This presents a fantastic data source to help answer urban planning questions, but OpenStreetMap’s data has been somewhat difficult to work with due to its Byzantine query language and coarse-grained bulk extracts provided by third parties. As part of my dissertation, I developed a tool called OSMnx that allows researchers to download street networks and building footprints for any city name, address, or polygon in the world, then analyze and visualize them. OSMnx democratizes these data and methods to help technical and non-technical planners and researchers use OpenStreetMap data to study urban form, circulation networks, accessibility, and resilience.