Categories
Planning

Rental Housing Spot Markets

My new article, “Rental Housing Spot Markets: How Online Information Exchanges Can Supplement Transacted-Rents Data,” with Jake Wegmann and Junfeng Jiao is now published in the Journal of Planning Education and Research (download free PDF).

How much does it cost to rent a typical apartment in your city? Answering this basic housing question can be surprisingly difficult. Consider the case of San Francisco in early 2018.

Categories
Planning

New Article: Urban Street Networks in EP-B

My article, “A Multi-Scale Analysis of 27,000 Urban Street Networks: Every US City, Town, Urbanized Area, and Zillow Neighborhood,” was recently published in Environment and Planning B: Urban Analytics and City Science. This study uses OSMnx to download and analyze 27,000 street networks from OpenStreetMap at metropolitan, municipal, and neighborhood scales – namely, every US city and town, census urbanized area, and Zillow-defined neighborhood. It illustrates the use of OSMnx and OpenStreetMap to consistently conduct street network analysis with extremely large sample sizes, with clearly defined network definitions and extents for reproducibility, and using nonplanar, directed graphs.

These 27,000 street networks as well as their measures have been shared in a free public repository at the Harvard Dataverse for anyone to re-purpose. This study’s empirical findings emphasize measures relevant to graph theory, transportation, urban design, and morphology, such as structure, connectedness, density, centrality, and resilience. It uses graph Maximum Betweenness Centrality and Average Node Connectivity to examine how “resilient” a street network is, in terms of how reliant it is on important nodes and how easy it is to disconnect it.
Categories
Planning

Estimating Daytime Density in RSRS

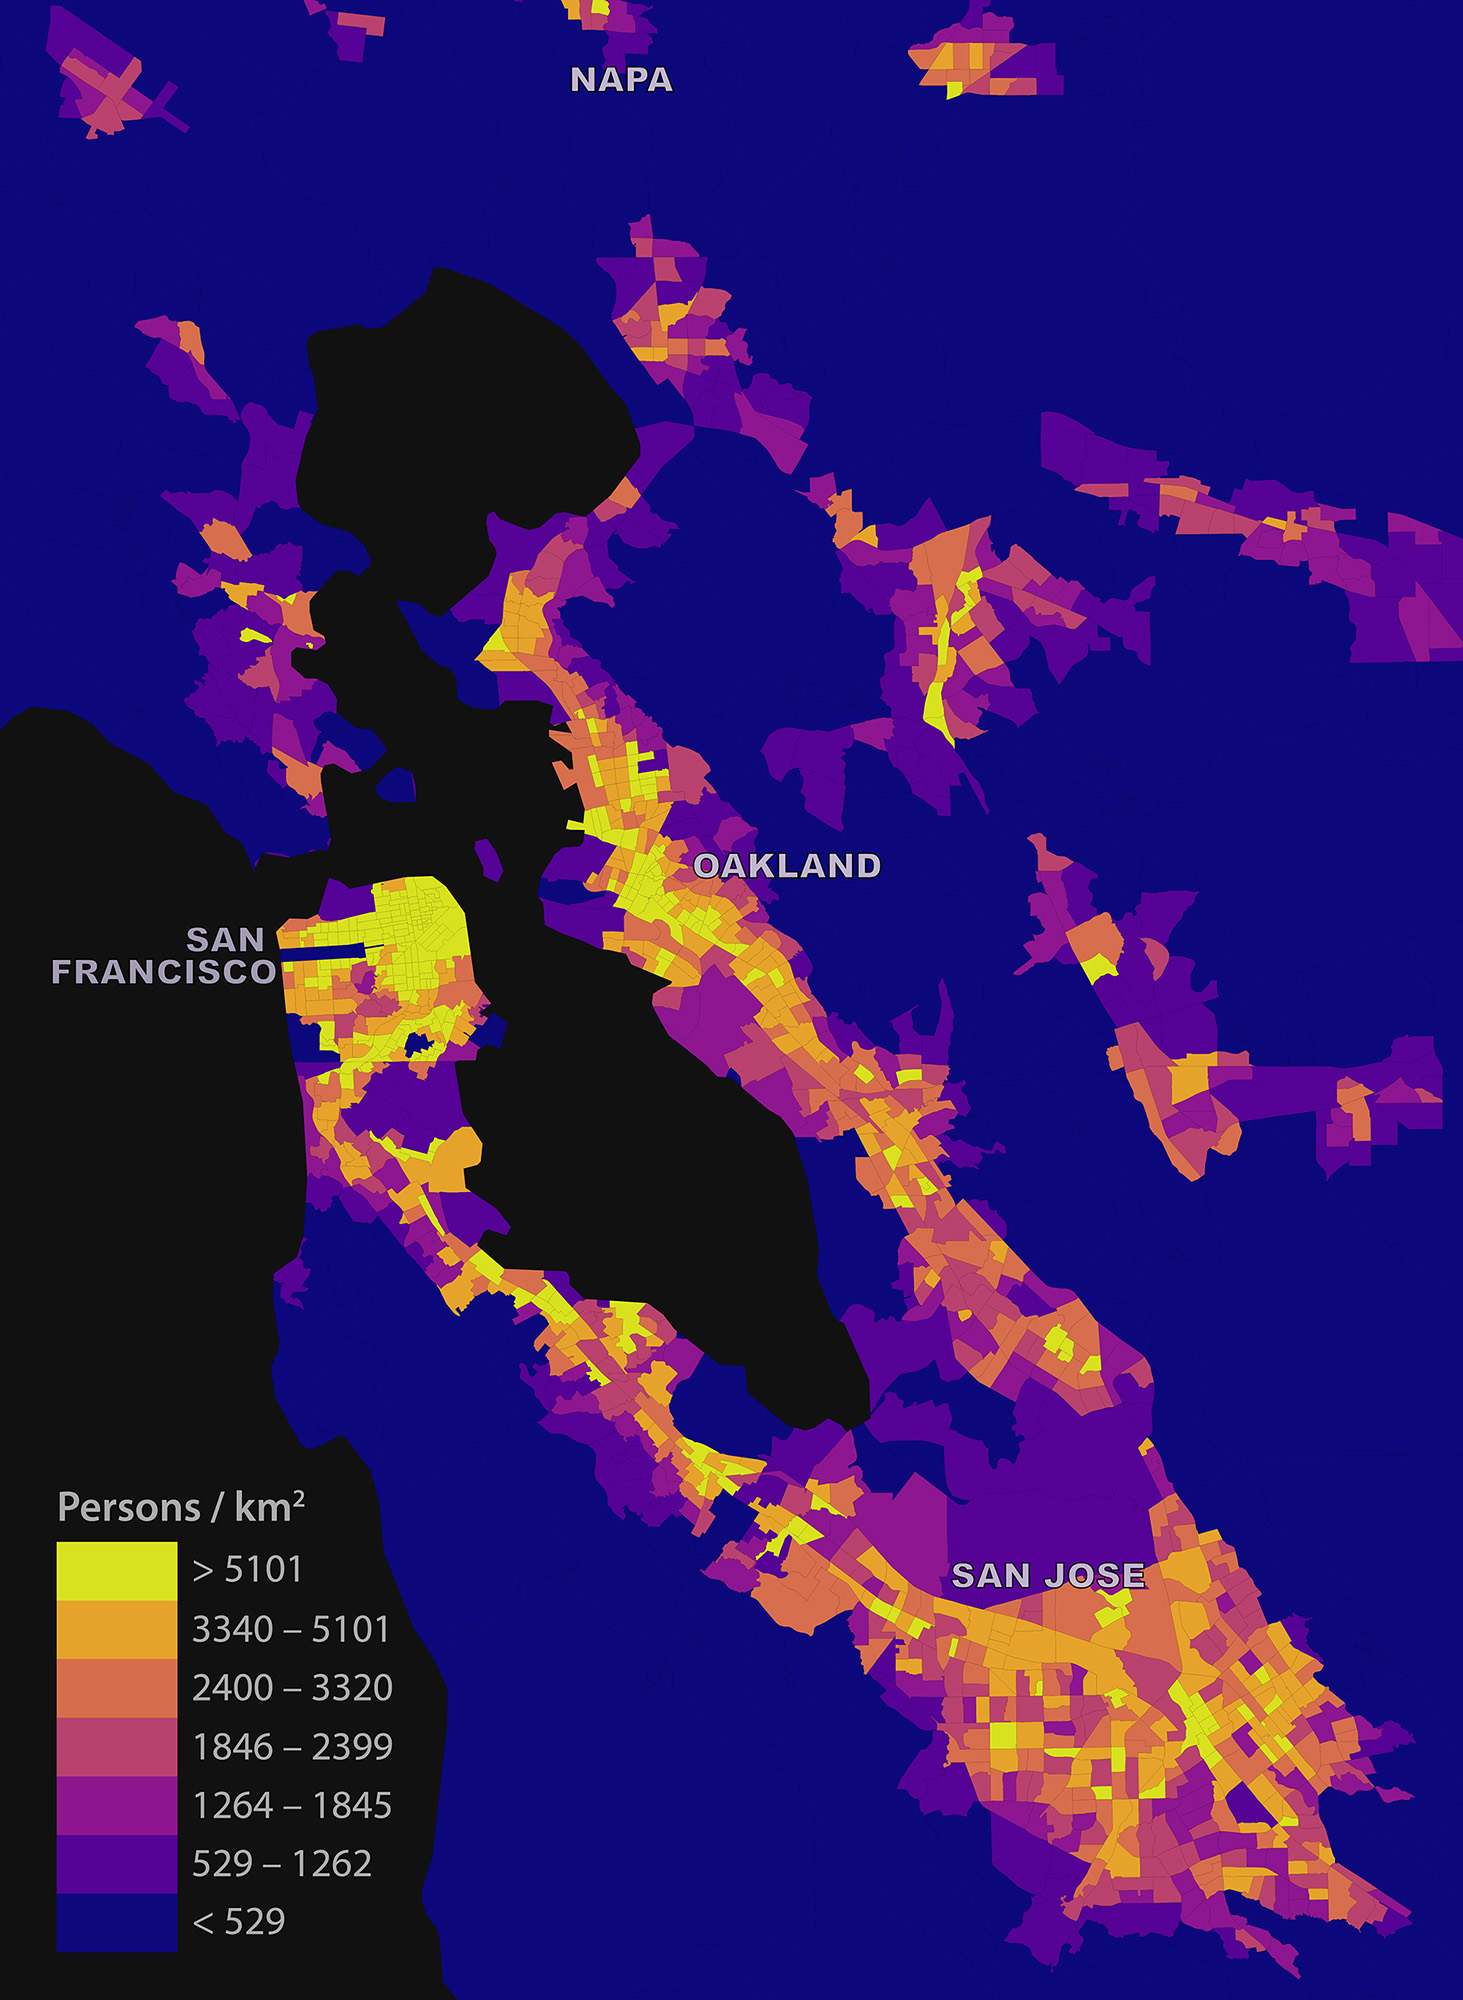
My short article “Estimating Local Daytime Population Density from Census and Payroll Data” is out now in the latest issue of Regional Studies, Regional Science. I discuss a method for estimating local daytime density across a metropolitan area using US Census and LEHD LODES data, and dig into some limitations and biases. I look at the San Francisco Bay Area as a case study:

Map of the estimated daytime population density in the San Francisco Bay Area

Categories
Planning

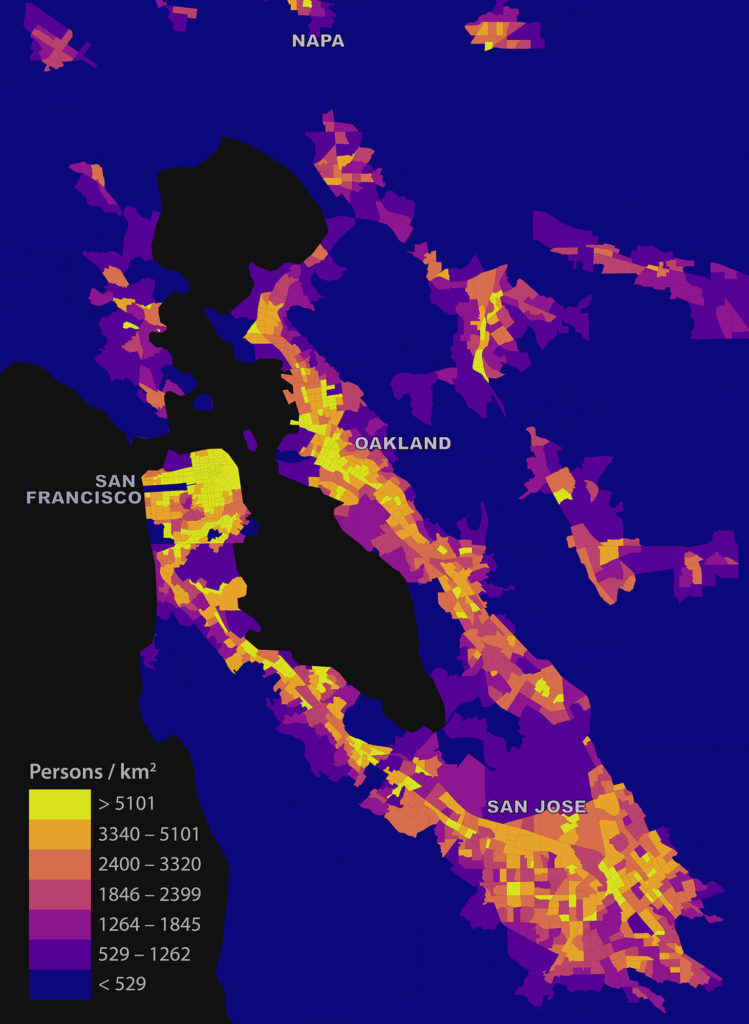
Estimating Daytime Population Density

Check out the journal article about this project.

I was recently asked: “how might someone figure out the local daytime population density across the Bay Area from public data?” My answer, in short, was that you really couldn’t accurately. But you could at least produce a coarse, biased estimate. Here’s how.

I examined the Bay Area’s tract-level daytime population density using three input data products: the 2010 TIGER/Line census tracts shapefile with DP1 attributes, the 2010 California LEHD LODES data, and the census bureau’s 2010 US states shapefile. I preferred the 2010 census demographic data to (more recent) ACS data because the ACS tract-level variables are five-year rolling averages. Given this, I preferred not to compare 2014 LODES data to 2010-2014 ACS data as the Bay Area experienced substantial housing, economic, and demographic upheaval over this interval – patterns obscured in the ACS rolling average. To avoid inconsistent comparison, I opted for more stale – but more accurate and comparable – data.

Map of the estimated daytime population density in the San Francisco Bay Area

Categories
Data

The Landscape of U.S. Rents

Which U.S. cities are the most expensive for rental housing? Where are rents rising the fastest? The American Community Survey (ACS) recently released its latest batch of 1-year data and I analyzed, mapped, and visualized it. My methodology is below, and my code and data are in this GitHub repo.

This interactive map shows median rents across the U.S. for every metro/micropolitan area. Click any one for details on population, rent, and change over time. Click “switch” to re-draw the map to visualize how median rents have risen since 2010: