Urban Form Figure-Ground Diagrams
Check out the journal article about OSMnx.
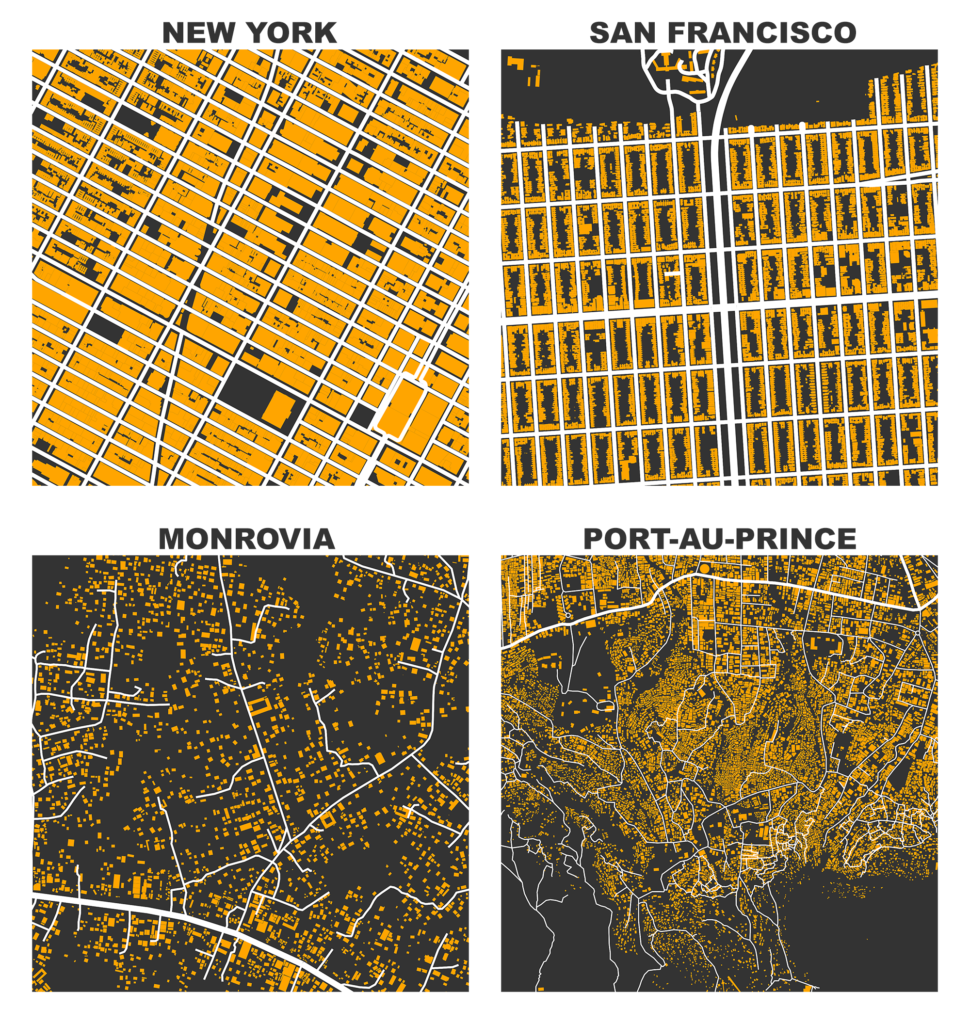
I previously demonstrated how to create figure-ground square-mile visualizations of urban street networks with OSMnx to consistently compare city patterns, design paradigms, and connectivity. OSMnx downloads, analyzes, and visualizes street networks from OpenStreetMap but it can also get building footprints. If we mash-up these building footprints with the street networks, we get a fascinating comparative window into urban form:

Above we see four cities, all at the same scale (one square mile) to allow easy comparison of the pattern, texture, and grain of the urban form. At the top-left lies densely built midtown Manhattan, with large buildings filling most of the space between streets. Within this square mile, there are 2,237 building footprints with a median area of 241 m2. At the top-right, we see the medium-density perimeter blocks of San Francisco’s Richmond district. Here the building footprints line the streets while leaving the centers of each block open for residents. Within this square mile, there are 5,054 building footprints with a median area of 142 m2.
The bottom row reveals an entirely different mode of urbanization, by visualizing slums in Monrovia, Liberia and Port-au-Prince, Haiti. These informal settlements are much finer-grained, and are not structured according to the orderly logic of the American street grids. Monrovia’s square mile contains 2,543 building footprints with a median area of 127 m2. Port-au- Prince’s square mile contains an incredible 14,037 building footprints with a median area of just 34 m2. Compared to New York’s macro-form, the Port-au- Prince informal settlement’s urban fabric resembles a remarkable dusting of urbanization. Notice, too, the percolation (or lack thereof) of the circulation networks into each informal settlement.
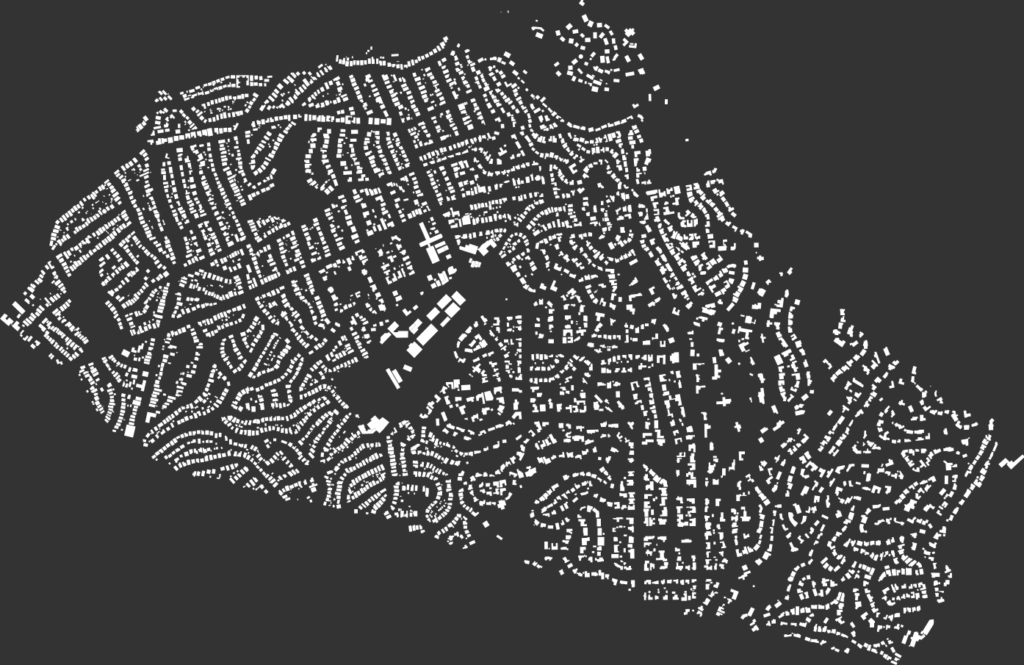
Figure-ground diagrams like these are common tools in urban planning and design to represent the relationship between built and un-built space in a city. An early example is the Nolli Map of Rome from the 1740s. We can use OSMnx to produce a similar map of a city - in this example, suburban Piedmont, California:

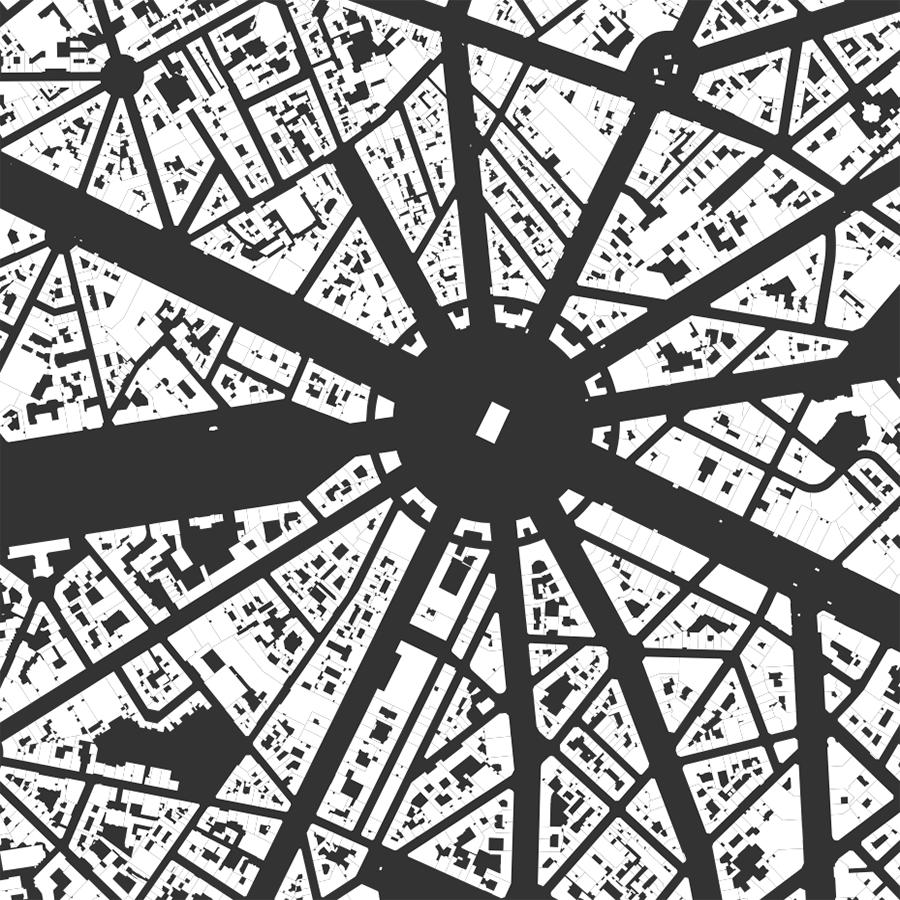
Piedmont’s curving streets can be seen winding through the built form, which comprises almost exclusively single-family detached homes. By contrast, we may want to examine just one section of a city, such as this 1.5 km2 diagram of Paris, centered on the Arc de Triomphe. Notice how Baron Haussmann’s streets radiate outward as remnants of his massive demolition and renovation of 19th century Paris:

Each of these visualizations was created in just a handful of lines of code using OSMnx, a Python package I’ve developed as part of my dissertation. The code to reproduce these figures is in this demo notebook. Several more examples are available in OSMnx’s GitHub repo. For more info, check out the paper about OSMnx.