Urban Form Analysis with OpenStreetMap Data
Check out the journal article about OSMnx. This is a summary of some of my recent research on making OpenStreetMap data analysis easy for urban planners. It was also published on the ACSP blog.
OpenStreetMap—a collaborative worldwide mapping project inspired by Wikipedia—has emerged in recent years as a major player both for mapping and acquiring urban spatial data. Though coverage varies somewhat worldwide, its data are of high quality and compare favorably to CIA World Factbook estimates and US Census TIGER/Line data. OpenStreetMap imported the TIGER/Line roads in 2007 and since then its community has made numerous corrections and improvements. In fact, many of these additions go beyond TIGER/Line’s scope, including for example passageways between buildings, footpaths through parks, bike routes, and detailed feature attributes such as finer-grained street classifiers, speed limits, etc.
This presents a fantastic data source to help answer urban planning questions, but OpenStreetMap’s data has been somewhat difficult to work with due to its Byzantine query language and coarse-grained bulk extracts provided by third parties. As part of my dissertation, I developed a tool called OSMnx that allows researchers to download street networks and building footprints for any city name, address, or polygon in the world, then analyze and visualize them. OSMnx democratizes these data and methods to help technical and non-technical planners and researchers use OpenStreetMap data to study urban form, circulation networks, accessibility, and resilience.
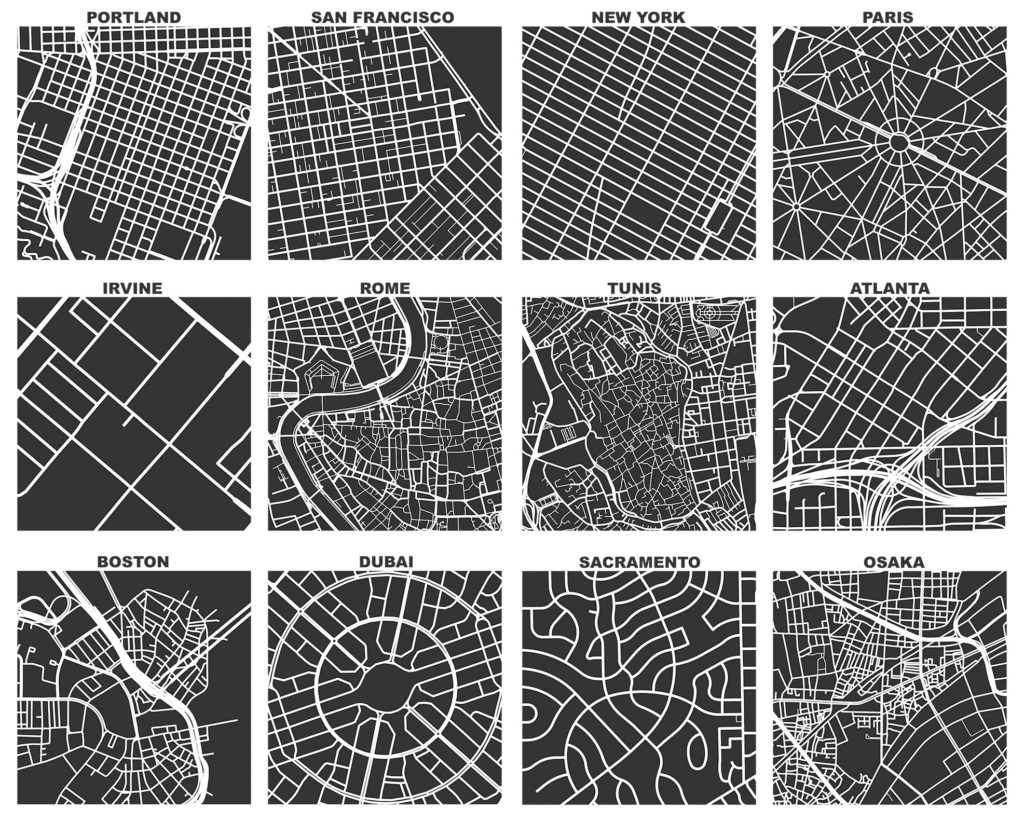
This sort of street network data can be useful for communicating urban design. Allan Jacobs’ classic book Great Streets featured dozens of hand-drawn figure-ground diagrams depicting one square mile of cities’ street networks. Holding these cities at the same scale provides a revealing spatial objectivity in comparing their street networks and urban forms. We can automatically re-create these with OpenStreetMap data for any city in the world, using OSMnx:
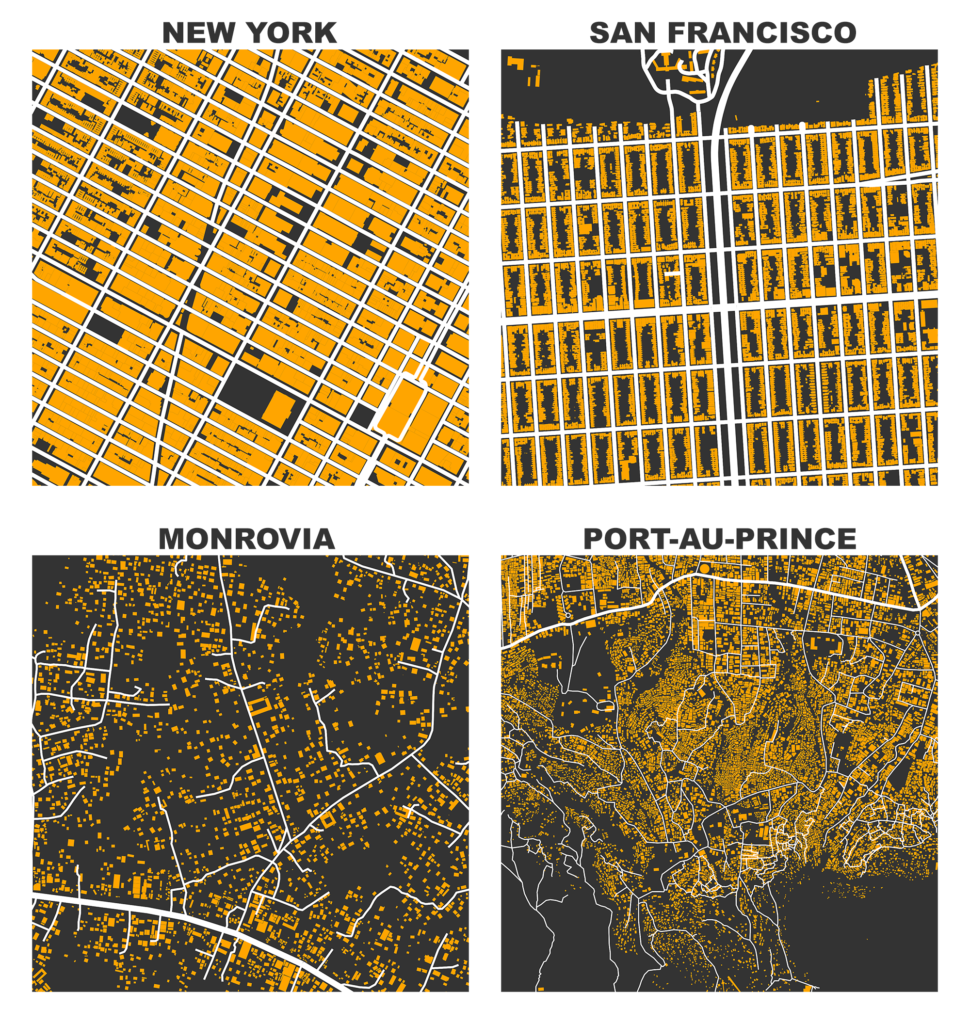
Each image was created with a single line of code. Adding in building footprints, we can see the texture, grain, and percolation of formal circulation networks in cities around the world, including informal settlements:
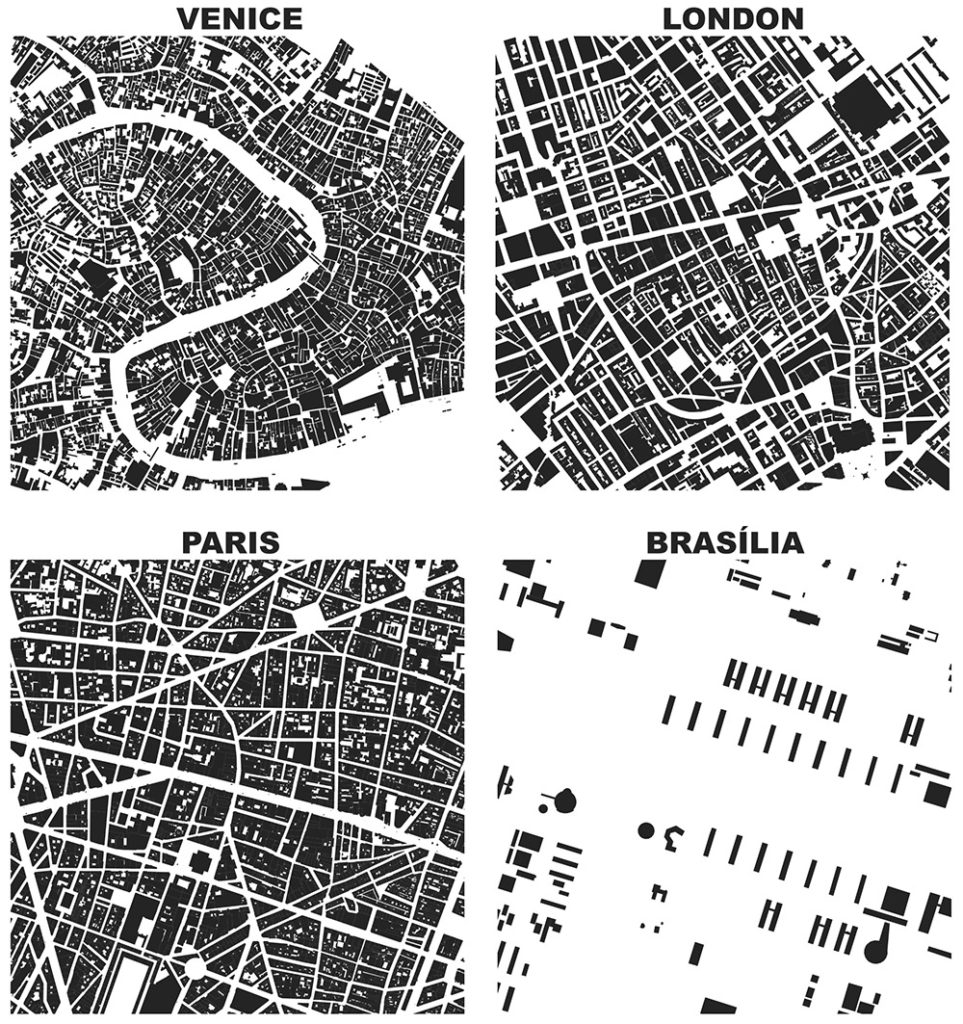
Or how about modernism’s inversion of traditional urban spatial order, neatly illustrated by the building footprints in central Brasília (inspired by James Holston’s The Modernist City):
These are still all one square-mile, held at the same scale. However, a single square mile cannot be taken as representative of broader scales or other locations within the city. Portland’s suburban east and west sides look very different than its downtown, and Sacramento’s compact, grid-like downtown looks very different than its residential suburbs. These visualizations, rather, show us how different urbanization modes, patterns, and paradigms compare at the same scale. This can serve both as a tool for comprehending the physical outcomes of planning and informal urbanization, as well as a tool for communicating urban planning and design in a clear and immediate manner to laymen.
Consider a common transportation planning research question: what role do land use and urban design play in reducing automobile reliance or increasing active travel? We might build a regression model to predict VMT in different places as a function of their D variables: density, land use diversity, street network and streetscape design, distance to transit, destination accessibility, and demographics. OpenStreetMap can help us quickly acquire those design variables—such as intersection density, block size, and the proportions of four-way intersections, dead-ends, etc. For example, with OSMnx we can download then analyze a street network in two lines of simple, readable Python code:
G = osmnx.graph_from_place('Berkeley, CA', network_type='drive')
stats = osmnx.basic_stats(G)
And just like that, we have Berkeley’s intersection density, average block size, street circuity, distribution of intersection types, and dozens more variables. Instead of a city name, we could pass in a list of polygons such as neighborhood shapes, addresses and buffer distances, etc. Or we could pass in a list of 100 (or 100,000) city names or polygons to automatically download all of their street networks, analyze them, and give us a table of variables to study. Finally, we’re not limited to driving networks: we can instead get walkable, bikeable, or everything all together.
Given OpenStreetMap’s vast repository of walking paths and bike routes, we can easily model how trip distances and times, routing options, and accessibility change from one network type to another. OSMnx has built-in shortest path calculators to find the network distance between any two addresses or points. Beyond the basic network stats common in urban morphology and design, we can just as easily calculate advanced topological measures such as betweenness centralities, clustering coefficients, PageRanks, etc. Such measures have arisen recently from the study of complex networks in statistical physics, and provide insight into a network’s structure, performance, and resilience. Consider three small network subsets in different neighborhoods of Portland, Oregon:

Each image shows half a km2. Downtown has an orthogonal grid with compact blocks, Laurelhurst shows its early 20th century Olmstead-influenced roots, and Northwest Heights has a winding, sprawling late-20th century suburban street network. OSMnx tells us over 90% of Downtown’s nodes (i.e., intersections and dead-ends) are 4-way intersections (note that OSMnx correctly recognizes that 4-way intersections at the periphery of these network subsets are indeed 4-way intersections, even though they may appear to be 3-way because a street was cut off by the bounding box). 55% of Laurelhurst’s and only 5% of Northwest Heights are 4-way intersections.
Now if we look at resilience by way of node betweenness centrality, we see that 7% of all shortest paths pass through an average node in Downtown, 8% in Laurelhurst, and 14% in Northwest Heights. More importantly, Northwest Heights’ two most important nodes are critical chokepoints connecting the network’s east and west sides. The most important node in Northwest Heights has 43% of all shortest paths running through it. By contrast, the most important node in Downtown has only 15%. The former’s street network may be more prone to disruption if its most important node fails (due to a traffic jam, flood, earthquake, etc.) than the latter’s.
OpenStreetMap offers a useful new data repository for walkability studies, urban form modeling, and computational urban design. Even if you’re new to Python, OSMnx offers an easy way to get started working with this rich urban dataset. For more info, check out the paper about OSMnx or the empirical study of 27,000 U.S. street networks.