How to Visualize Urban Accessibility and Walkability
Tools like WalkScore visualize how “walkable” a neighborhood is in terms of access to different amenities like parks, schools, or restaurants. It’s easy to create accessibility visualizations like these ad hoc with Python and its pandana library. Pandana (pandas for network analysis - developed by Fletcher Foti during his dissertation research here at UC Berkeley) performs fast accessibility queries over a network. I’ll demonstrate how to use it to visualize urban walkability. My code is in these IPython notebooks in this urban data science course GitHub repo.
First I give pandana a bounding box around Berkeley/Oakland in the East Bay of the San Francisco Bay Area. Then I load the street network and amenities from OpenStreetMap. In this example I’ll look at accessibility to restaurants, bars, and schools. But, you can create any basket of amenities that you are interested in - basically visualizing a personalized “AnythingScore” instead of a generic WalkScore for everyone. Finally I calculate and plot the distance from each node in the network to the nearest amenity:
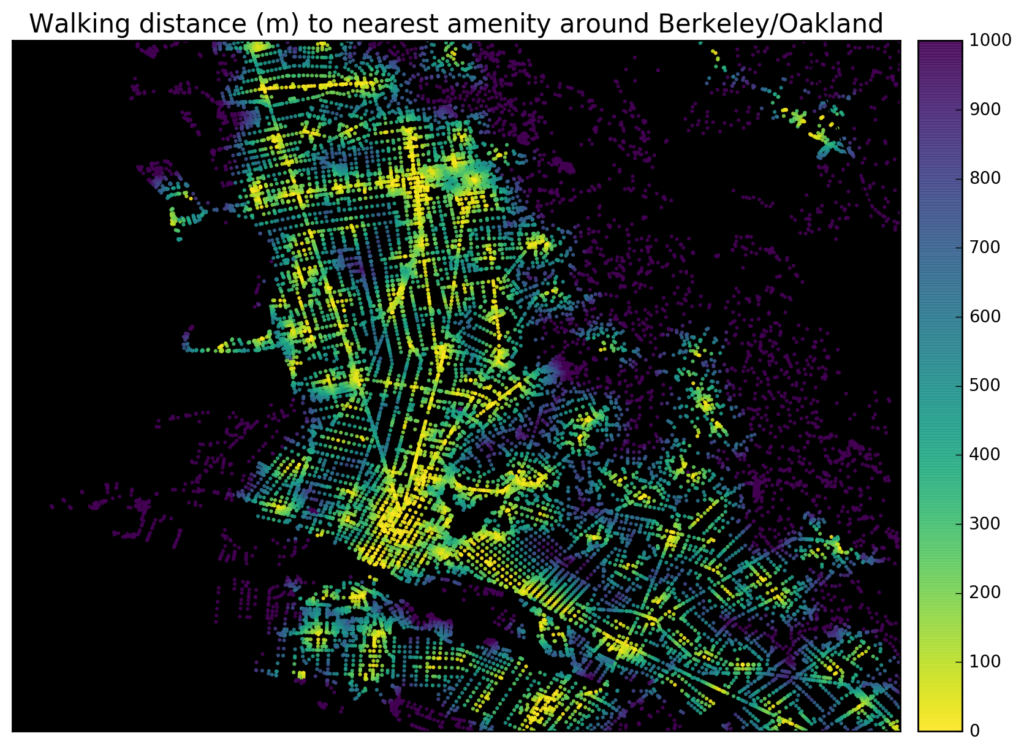
The map shows the walking distance in meters from each network node to the nearest restaurant, bar, or school. But, a better indicator of accessibility might be having access to a large number of amenities. So instead of the nearest, I’ll plot accessibility to the fifth-nearest amenity:
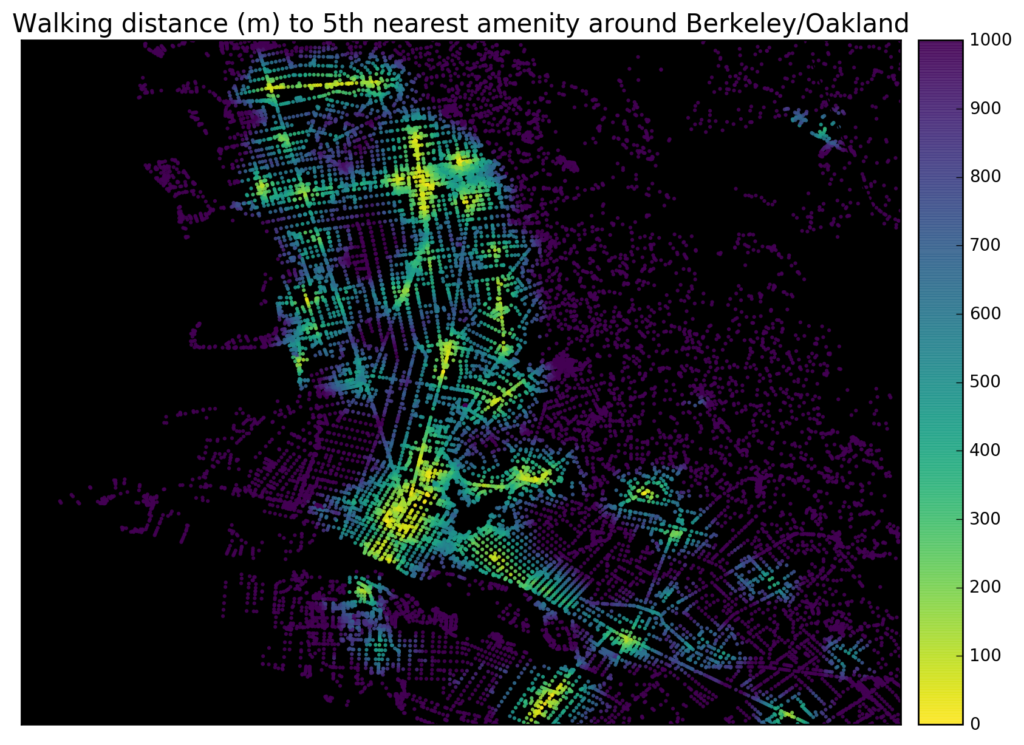
This map more clearly reveals high-amenity hot spots around downtown Oakland and downtown Berkeley. We can also break out our amenities individually. Here is access to the nearest bar:
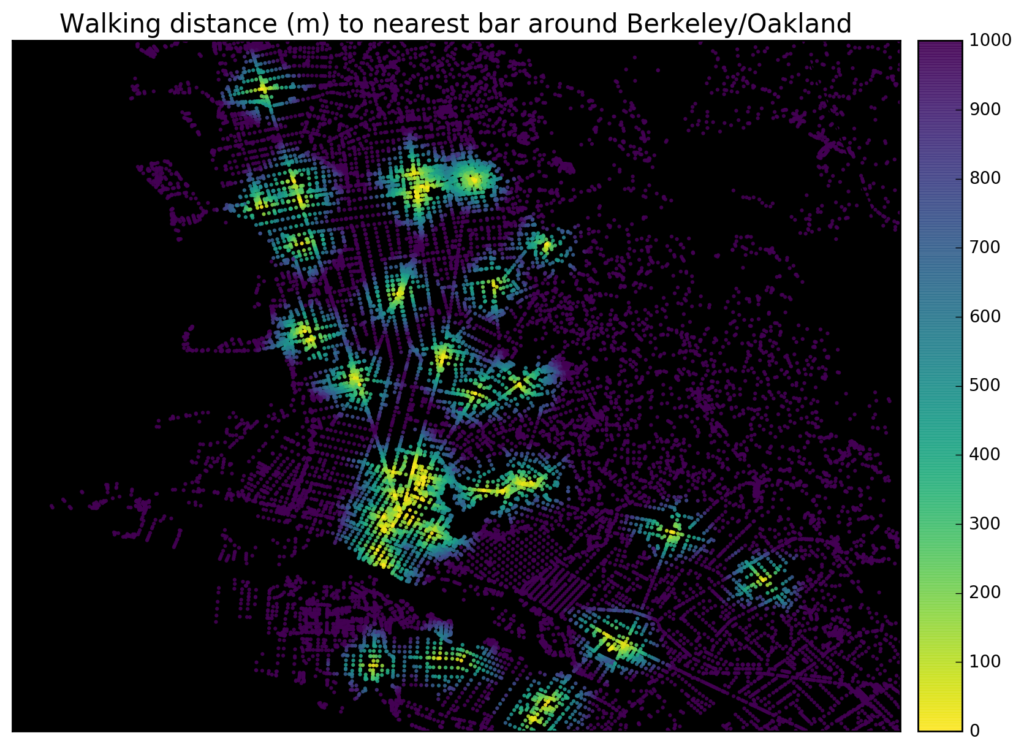
Compare that to the accessibility to the nearest school:
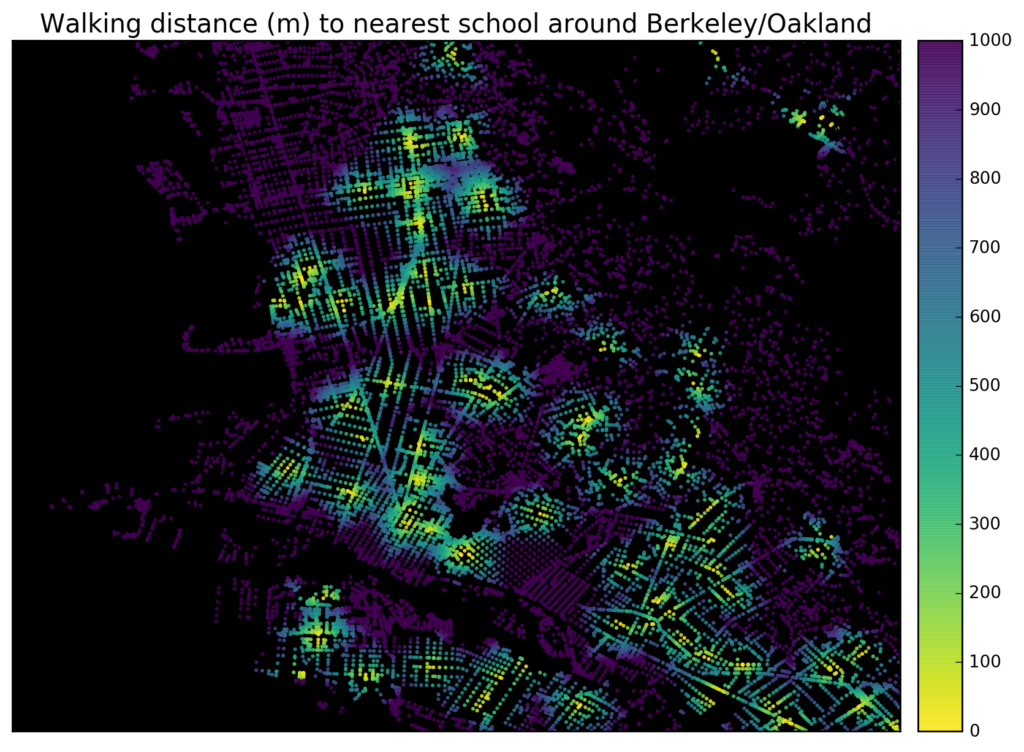
Unsurprisingly, different neighborhoods have very different levels of access to schools versus bars. And, there are large residential swaths of the East Bay with no schools within easy walking distance. An interesting next step would be to aggregate accessibility to the census tract and examine how it correlates with socio-demographic variables like race, education, and income.
Check out these IPython notebooks in this urban data science GitHub repo for more demos of using pandana to visualize urban accessibility and walkability in Python.