The fall semester begins next week at UC Berkeley. For the third year in a row, Paul Waddell and I will be teaching CP255: Urban Informatics and Visualization, and this is my first year as co-lead instructor.
This masters-level course trains students to analyze urban data, develop indicators, conduct spatial analyses, create data visualizations, and build  interactive web maps. To do this, we use the Python programming language, open source analysis and visualization tools, and public data.
This course is designed to provide future city planners with a toolkit of technical skills for quantitative problem solving. We don’t require any prior programming experience – we teach this from the ground up – but we do expect prior knowledge of basic statistics and GIS.
Update, September 2017: I am no longer a Berkeley GSI, but Paul’s class is ongoing. Check out his fantastic teaching materials in his GitHub repo. From my experiences here, I have developed a course series on urban data science with Python and Jupyter, available in this GitHub repo.
 Check out the journal article about OSMnx, which implements this technique.
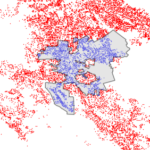
 Rentals make up a significant portion of the U.S. housing market, but much of this market activity is poorly understood due to its informal characteristics and historically minimal data trail. The UC Berkeley Urban Analytics Lab collected, validated, and analyzed 11 million Craigslist rental listings to discover fine-grained patterns across metropolitan housing markets in the United States. I’ll summarize our findings below and explain the methodology at the bottom.
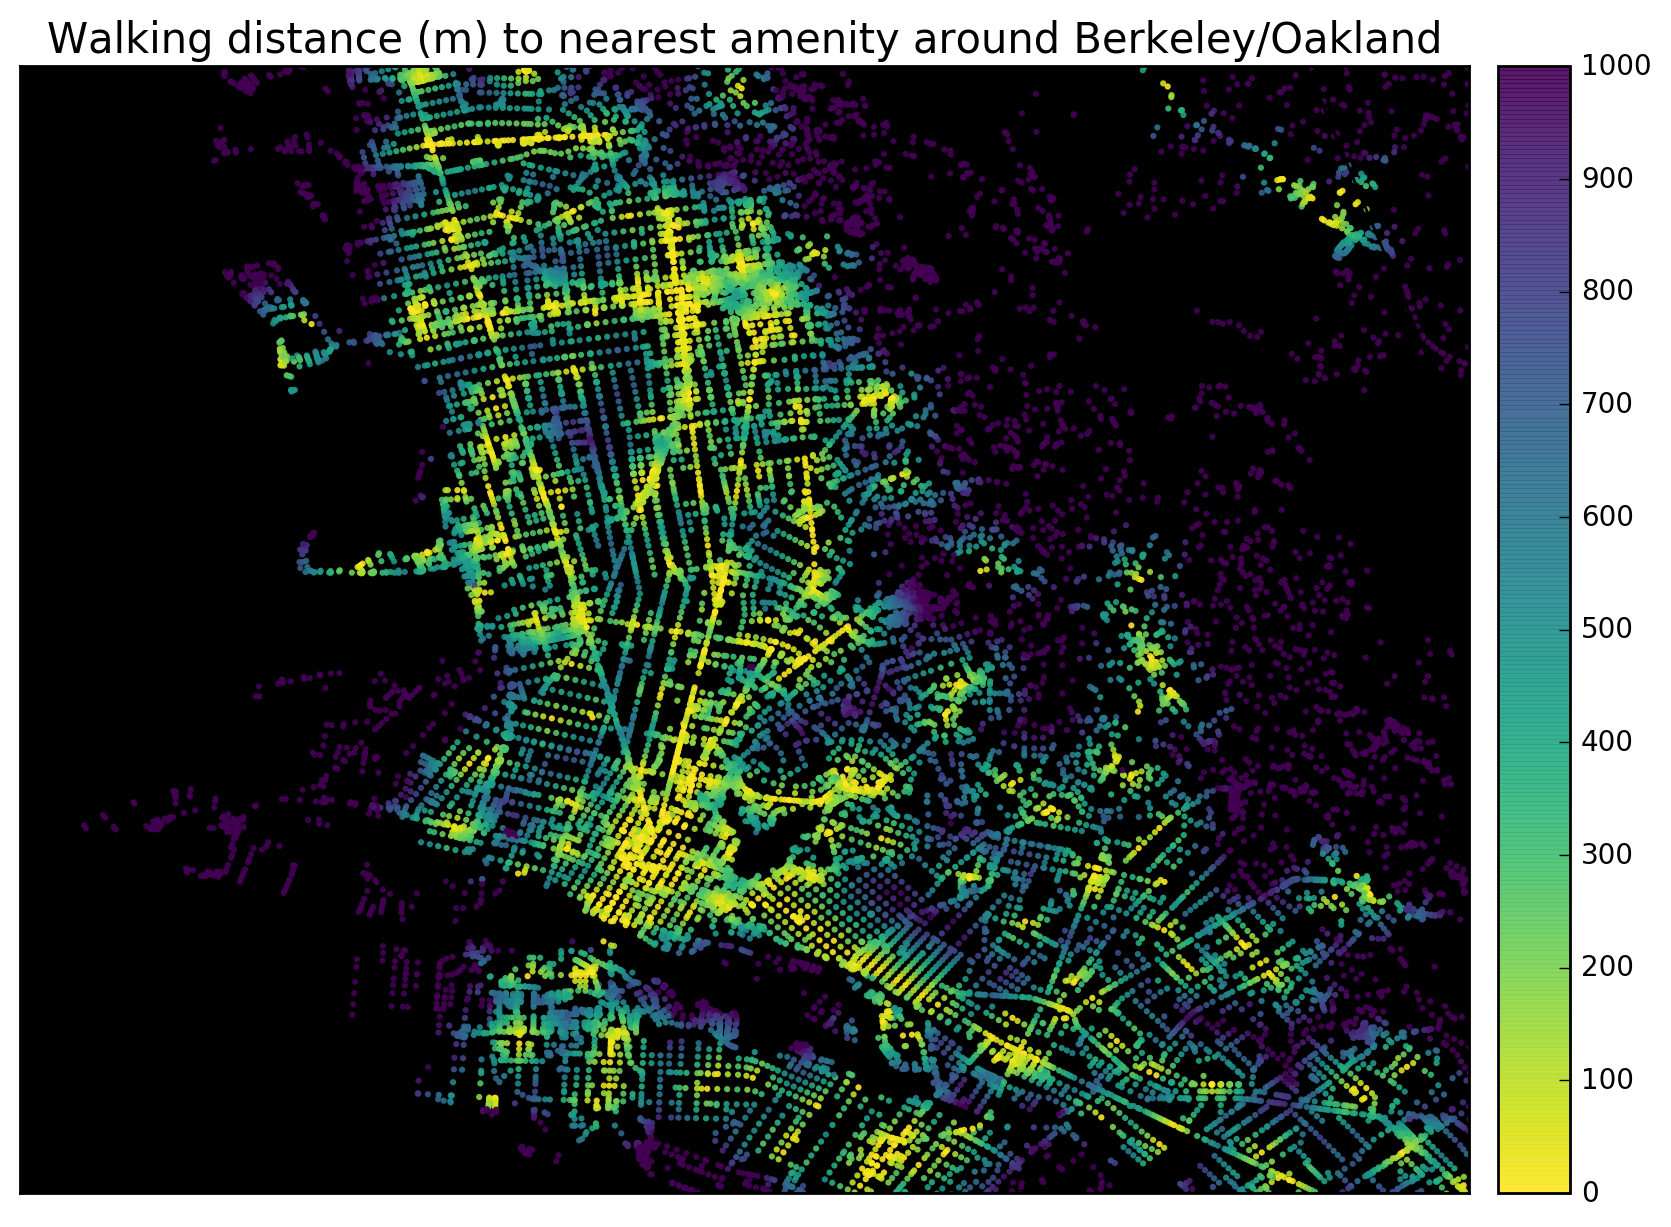

 I am presenting at the 2015