Categories
Academia

Fall Conference Presentations

I’ve been traveling a lot over the past month, presenting my recent research at the Architect of the Future conference in Moscow, the Venice Biennale of Architecture, and the ACSP conference in Buffalo. At the first two, I shared my recent findings on how planners have used street networks to organize urban space according to an evolving set of spatial logics during the 20th century. At the third, I shared my findings on how technology platforms like Craigslist can shape rental housing markets and also shape how researchers and policymakers understand affordability. Both papers coming soon.

Looking ahead to the spring, in April I’ll be presenting at UAA in Los Angeles as well as a full slate at AAG in Washington, where I’ll give a paper talk, speak on an urban data science panel, and deliver the Transactions in GIS plenary address. See you there!
Categories
Data

Mapping Everywhere I’ve Ever Been in My Life

I recently wrote about visualizing my Foursquare check-in history and mapping my Google location history, and it inspired me to mount a more substantial project: mapping everywhere I’ve ever been in my life (!!). I’ve got 4 years of Foursquare check-ins and Google location history data. For everything pre-smart phone, I typed up a simple spreadsheet of places I’d visited in the past and then geocoded it with the Google Maps API. All my Python and Leaflet code is available in this GitHub repo and is easy to re-purpose to visualize your own location history.
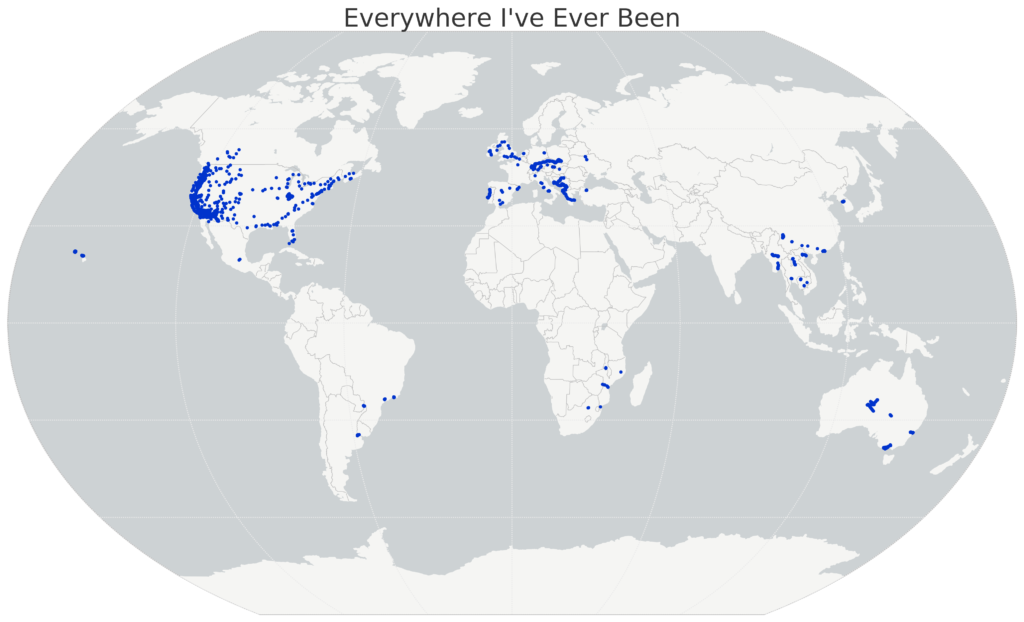
I’ll show the maps first, then run through the process I followed, below. First off, I used Python and matplotlib basemap to create this map of everywhere I’ve ever been:

Location History World Map, data from Foursquare and Google, made with Python matplotlib basemap

Categories
Data

Mapping Your Google Location History with Python

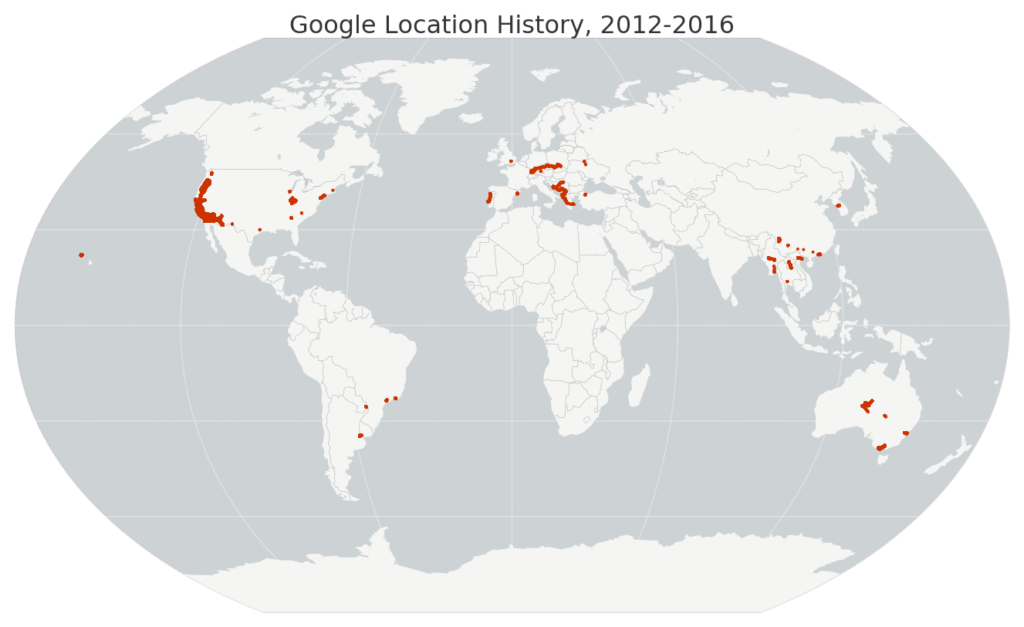
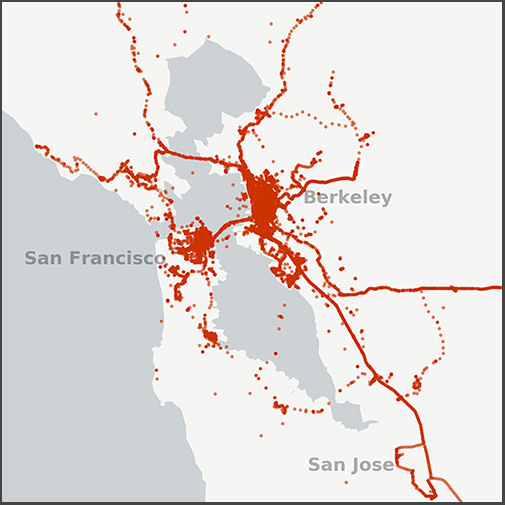
Small map of my Google location history data in the San Francisco Bay Area, 2012-2016I recently wrote about visualizing my Foursquare check-in history and it inspired me to map my entire Google location history data – about 1.2 million GPS coordinates from my Android phone between 2012 and 2016. I used Python and its pandas, matplotlib, and basemap libraries. The Python code is available in this notebook in this GitHub repo, and it’s simple to re-use to visualize your own location history.

Just download your JSON file from Google then run the code. First I load the JSON file and parse the latitude, longitude, and timestamp with pandas. Then I map my worldwide data set:

Map of my Google location history data worldwide, 2012-2016

Categories
Data

Visualize Foursquare Location History

I started using Foursquare at the end of 2012 and kept with it even after it became the pointless muck that is Swarm. Since I’ve now got 4 years of location history (ie, check-ins) data, I decided to visualize and map it with Python, matplotlib, and basemap. The code is available in this GitHub repo. It’s easy to re-purpose to visualize your own check-in history: you just need to plug in your Foursquare OAuth token then run the notebook.

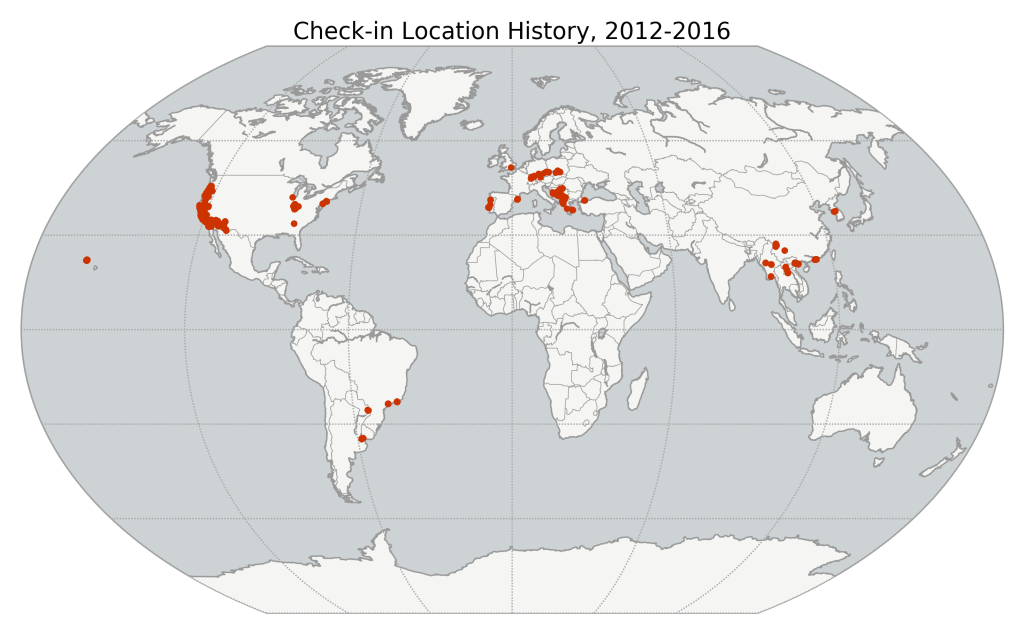
First the notebook downloads all my check-ins from the Foursquare API. Then I mapped all of them, using matplotlib basemap.

Map of Foursquare Swarm check-in location history

Categories
Travel

The Beautiful Cities of Eastern Europe

Western Europe gets all the attention, but that means it also gets all the tourists. Here are some of my favorite old cities that I’ve visited on the other side of the continent, along with a few photos I took while there. Granted, a few of these places are now squarely on the backpacker circuit, but many remain underexplored. What they all share is an incredible, exhilarating sense of urbanism — old and new.

Eastern Europe itself is hard to define. Competing designations might include only the former Soviet states, or all the formerly communist European nations. Others might separate a limited Eastern Europe out from Central and Southeastern Europe. Here I will play fast and loose with the geographic boundaries: these are just cities somewhere vaguely toward the eastern side of the continent. Apologies to any readers whose country is usually considered a part of Central or Southern Europe.

First up: Mostar. A small city in the south of Bosnia and Herzegovina, Mostar is most famous for its medieval Ottoman center and its Old Bridge, or Stari Most:

Stari Most old bridge in Mostar, Bosnia and Herzegovina

Categories
Travel

Off the Beaten Path in Laos

After my recent trip through Myanmar, I backpacked across Laos. Much like Myanmar, Laos was closed to tourism and the West for decades, but has recently re-opened its doors. Unlike Myanmar, Laos is officially a communist state – one of only five remaining in the world, alongside Cuba, China, Vietnam, and (nominally) North Korea.

laos-luang-prabang-kuang-si-3

Categories
Travel

Off the Beaten Path in Myanmar

myanmar-29I recently had the opportunity to travel across Myanmar for the first time. It’s a fascinating country, only recently emerging from decades of isolation. Travelers here today are greeted with the first few baby steps toward a tourism industry, as well some of the kindest people and most spectacular sights in Asia.

Myanmar is not the easiest country to approach. It remains, effectively, a military dictatorship wracked with corruption and abuse. Government officials control the airlines and hotels for personal profit. Large swaths of eastern Myanmar are dedicated to opium plantations funneling foreign currency into the pockets of powerful officials. Even its name is controversial: many foreign governments still officially recognize only its traditional name, Burma, as a political statement against the authoritarian regime that renamed it Myanmar in 1989. 

Categories
Travel

Hong Kong at Night

Hong Kong is a remarkable place. It is the 4th-densest sovereign state or self-governing territory in the world (in 1st place is its neighbor across the delta: Macau). Yet this density is fantastically constrained by the mountains and the sea into narrow, snaking corridors of high-rises wherever the terrain permits. At no time is this unique urban development better seen than at night, when Hong Kong lights up like a carnival.

I took these photos from the top of Victoria Peak on Hong Kong island and from the Tsim Sha Tsui promenade on the Kowloon peninsula, using long exposures of between 3 and 12 seconds.

hong-kong-skyline-night-2

Categories
Data

Visualizing Summer Travels Part 6: Projecting Spatial Data with Python

This post is part of a series on visualizing data from my summer travels.

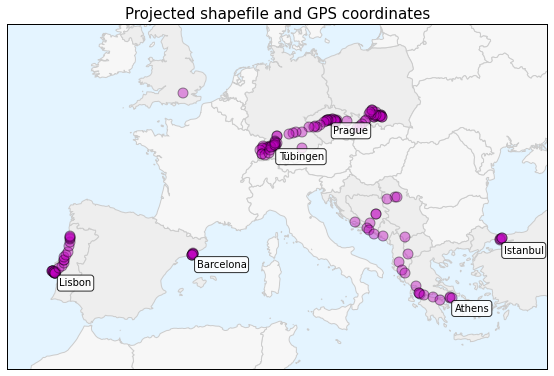
I’ve previously discussed visualizing the GPS location data from my summer travels with CartoDB, Leaflet, and Mapbox + Tilemill. I also visualized different aspects of this data set in Python, using the matplotlib plotting library. However, these spatial scatter plots used unprojected lat-long data which looked pretty distorted at European latitudes.

Today I will show how to convert this data into a projected coordinate reference system and plot it again using matplotlib. These projected maps will provide a much more accurate spatial representation of my spatial data and the geographic region. All of my code is available in this GitHub repo, particularly this notebook.

Categories
Data

Visualizing Summer Travels

projected-shapefile-gps-coordinatesThis is a series of posts about visualizing spatial data. I spent a couple of months traveling in Europe this summer and collected GPS location data throughout the trip with the OpenPaths app. I explored different web mapping technologies such as CartoDB, Leaflet, Mapbox, and Tilemill to plot my travels. I also used Python and matplotlib to run some descriptive statistics and visualize other aspects of my trip.

Here is the series of posts:

My Python code is available in this GitHub repo. I also did some more involved work under the hood to prep the data and support these visualizations. For example, in the following posts I reverse-geocoded the spatial data set and reduced its size with clustering algorithms and the Douglas-Peucker algorithm: