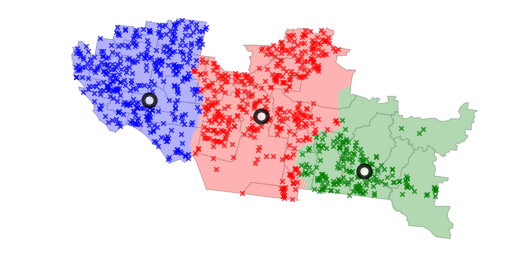
I recently teamed up with an international group of public health researchers and spatial analysts to co-author an article, An Introduction to Software Tools, Data, and Services for Geospatial Analysis of Stroke Services, that has been accepted for publication at Frontiers in Neurology (download free PDF).
Tag: science
AAG Transactions in GIS Plenary
I am giving the Transactions in GIS plenary address at the AAG conference this afternoon. I’ll be reflecting on urban science, spatial networks, and tool-building in academia, focusing on OSMnx. A paper will be forthcoming soon, but in the meantime, for any interested plenary session attendees or other folks, here are a few links to more info and related resources:
Getting started
What is OSMnx? What does it do? Here’s a succinct overview.
The easiest way to get started with street network modeling and analysis in OSMnx is with this docker image and these example/tutorial Jupyter notebooks. The OSMnx software documentation is available here and this journal article introduces it more formally.
US Street Network Models and Measures
My new article, “Street Network Models and Measures for Every U.S. City, County, Urbanized Area, Census Tract, and Zillow-Defined Neighborhood” has been published in Urban Science. This paper reports results from a broader project that collected raw street network data from OpenStreetMap using the Python-based OSMnx software for every U.S. city and town, county, urbanized area, census tract, and Zillow-defined neighborhood boundary. It constructed nonplanar directed multigraphs for each and analyzed their structural and morphological characteristics.
The resulting public data repository contains over 110,000 processed, cleaned street network graphs (which in turn comprise over 55 million nodes and over 137 million edges) at various scales—comprehensively covering the entire U.S.—archived as reusable open-source GraphML files, node/edge lists, and ESRI shapefiles that can be immediately loaded and analyzed in standard tools such as ArcGIS, QGIS, NetworkX, graph-tool, igraph, or Gephi.
Containerization is the way of the future present. I’ve heard feedback from some folks over the past few months who would like to play around with OSMnx for street network analysis, transport modeling, and urban design—but can’t because they can’t install Python and its data science stack on their computers. Furthermore, it would be nice to have a consistent reference environment to deploy on AWS or elsewhere in the cloud.
So, I’ve created a docker image containing OSMnx, Jupyter, and the rest of the Python geospatial data science stack, available on docker hub alongside additional usage instructions. If you’re starting from scratch, you can get started in four simple steps:
New Chapter: Street Network Morphology
My chapter The Morphology and Circuity of Walkable and Drivable Street Networks is now in-press for publication in the forthcoming book The Mathematics of Urban Morphology (download free PDF). The book integrates recent theoretical and empirical work from urban planning, geography, sociology, architecture, economics, and mathematics around the theme of how we model and understand the urban form’s physical patterns and shaping processes. Fellow authors in this volume include Michael Batty, Diane Davis, Keith Clarke, Bin Jiang, Kay Axhausen, Carlo Ratti, and Stephen Marshall. The book itself can be purchased here.
Spring Teaching
Happy new year! In the spring semester I’ll be teaching two new courses: Big Data for Cities and Advanced Spatial Analysis of Urban Systems. The former serves as a sort of gateway course to Northeastern’s urban informatics master’s program, introducing students to urban theories and scientific methods of analyzing urban data. The latter introduces advanced students to a computational workflow of spatial analysis and statistics with Python, PostGIS, and other open-source tools. I’ll be creating my lectures as Jupyter notebooks and will share a GitHub link soon when they’re all together.
My article, “Planarity and Street Network Representation in Urban Form Analysis,” was recently published in Environment and Planning B: Urban Analytics and City Science. Models of street networks underlie research in urban travel behavior, accessibility, design patterns, and morphology. These models are commonly defined as planar, meaning they can be represented in two dimensions without any underpasses or overpasses. However, real-world urban street networks exist in three-dimensional space and frequently feature grade separation such as bridges and tunnels: planar simplifications can be useful but they also impact the results of real-world street network analysis. This study measures the nonplanarity of drivable and walkable street networks in the centers of 50 cities worldwide, then examines the variation of nonplanarity across a single city. While some street networks are approximately planar, I empirically quantify how planar models can inconsistently but drastically misrepresent intersection density, street lengths, routing, and connectivity.
My article, Measuring the Complexity of Urban Form and Design, is now in-press for publication at Urban Design International (download free PDF). Cities are complex systems composed of many human agents interacting in physical urban space. This paper develops a typology of measures and indicators for assessing the physical complexity of the built environment at the scale of urban design. It extends quantitative measures from city planning, network science, ecosystems studies, fractal geometry, statistical physics, and information theory to the analysis of urban form and qualitative human experience.
My article, “A Multi-Scale Analysis of 27,000 Urban Street Networks: Every US City, Town, Urbanized Area, and Zillow Neighborhood,” was recently published in Environment and Planning B: Urban Analytics and City Science. This study uses OSMnx to download and analyze 27,000 street networks from OpenStreetMap at metropolitan, municipal, and neighborhood scales – namely, every US city and town, census urbanized area, and Zillow-defined neighborhood. It illustrates the use of OSMnx and OpenStreetMap to consistently conduct street network analysis with extremely large sample sizes, with clearly defined network definitions and extents for reproducibility, and using nonplanar, directed graphs.
These 27,000 street networks as well as their measures have been shared in a free public repository at the Harvard Dataverse for anyone to re-purpose. This study’s empirical findings emphasize measures relevant to graph theory, transportation, urban design, and morphology, such as structure, connectedness, density, centrality, and resilience. It uses graph Maximum Betweenness Centrality and Average Node Connectivity to examine how “resilient” a street network is, in terms of how reliant it is on important nodes and how easy it is to disconnect it.
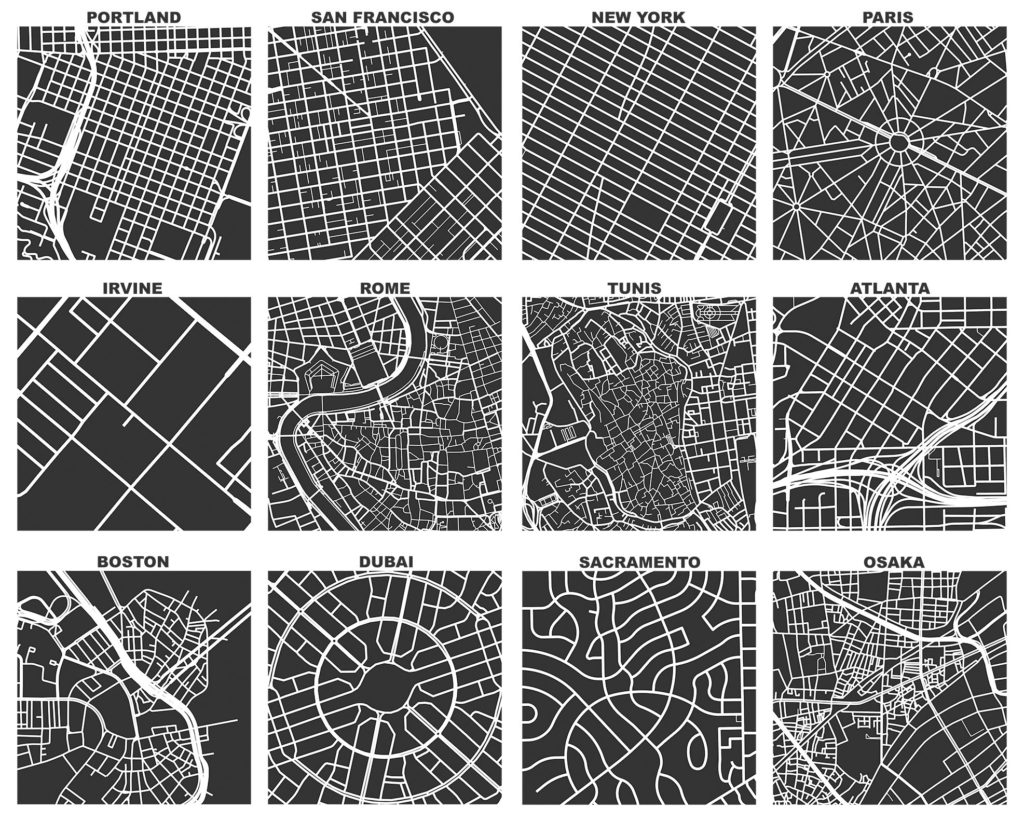
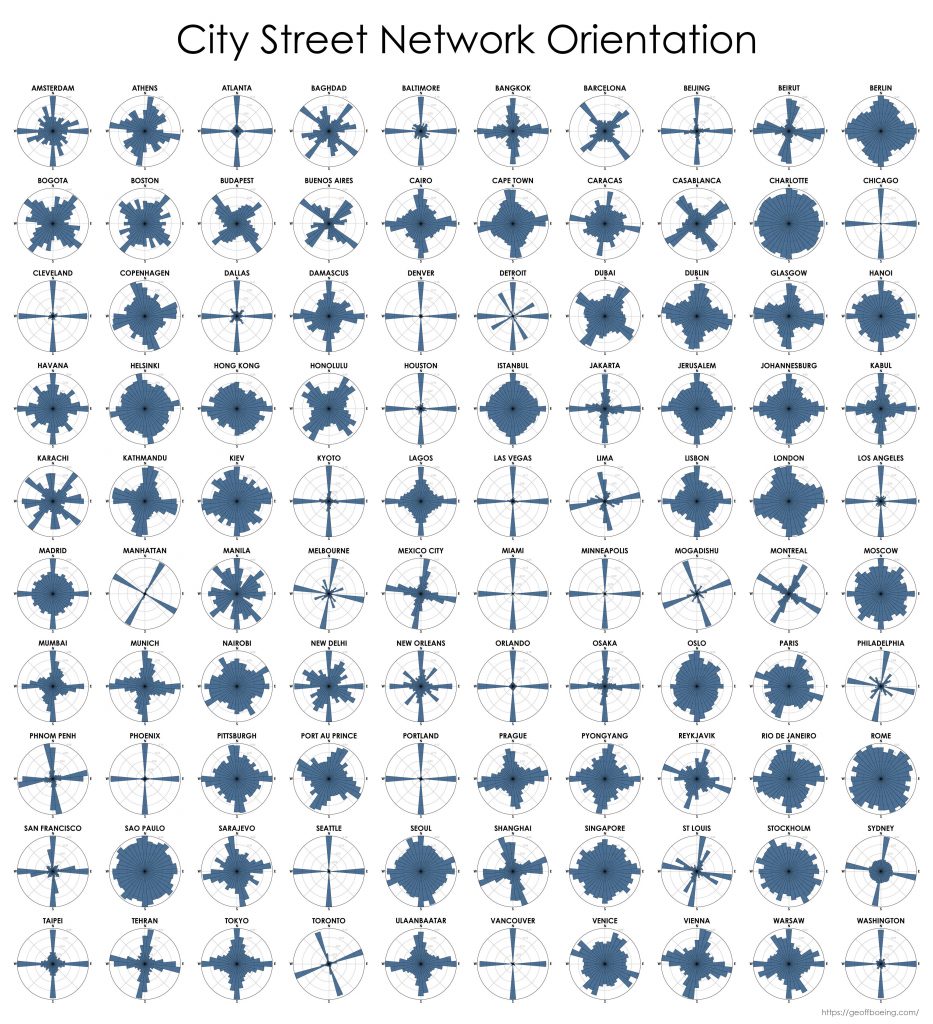
This post is adapted from this research paper that you can read/cite for more info. It analyzes and visualizes 100 cities around the world.
By popular request, this is a quick follow-up to this post comparing the orientation of streets in 25 US cities using Python and OSMnx. Here are 25 more cities around the world: