Categories
Planning

Square-Mile Street Network Visualization

Check out the journal article about OSMnx. All figures in this article come from this journal article, which you can read/cite for more.

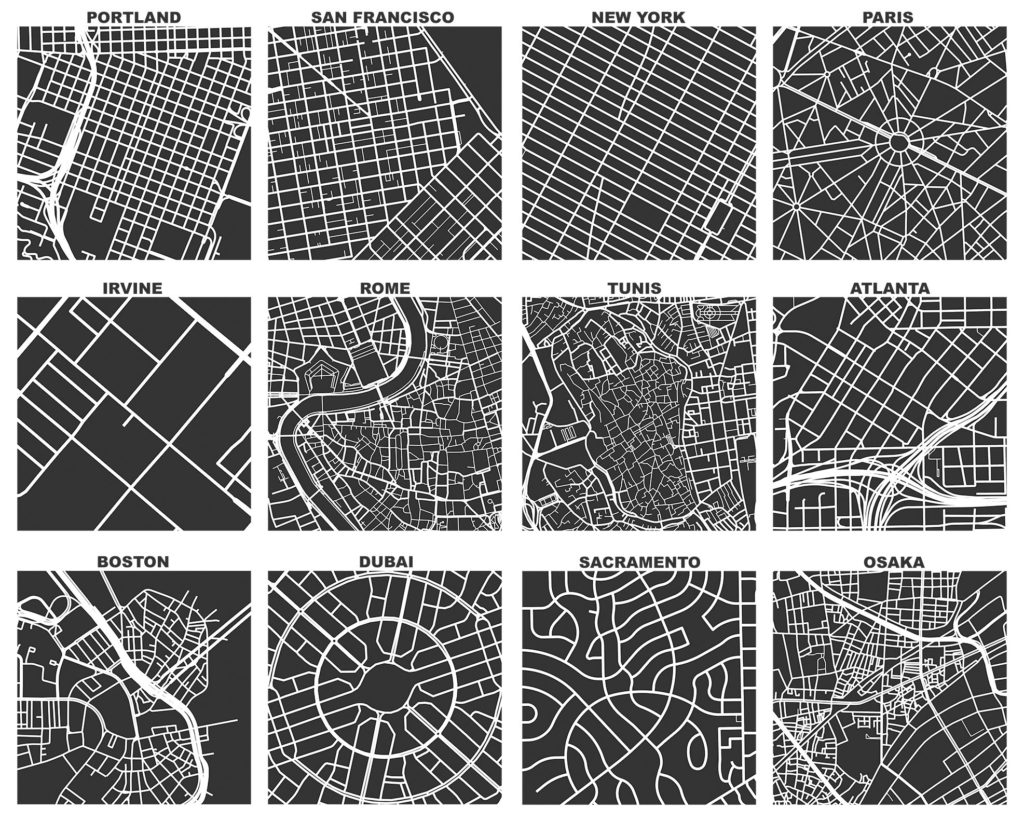
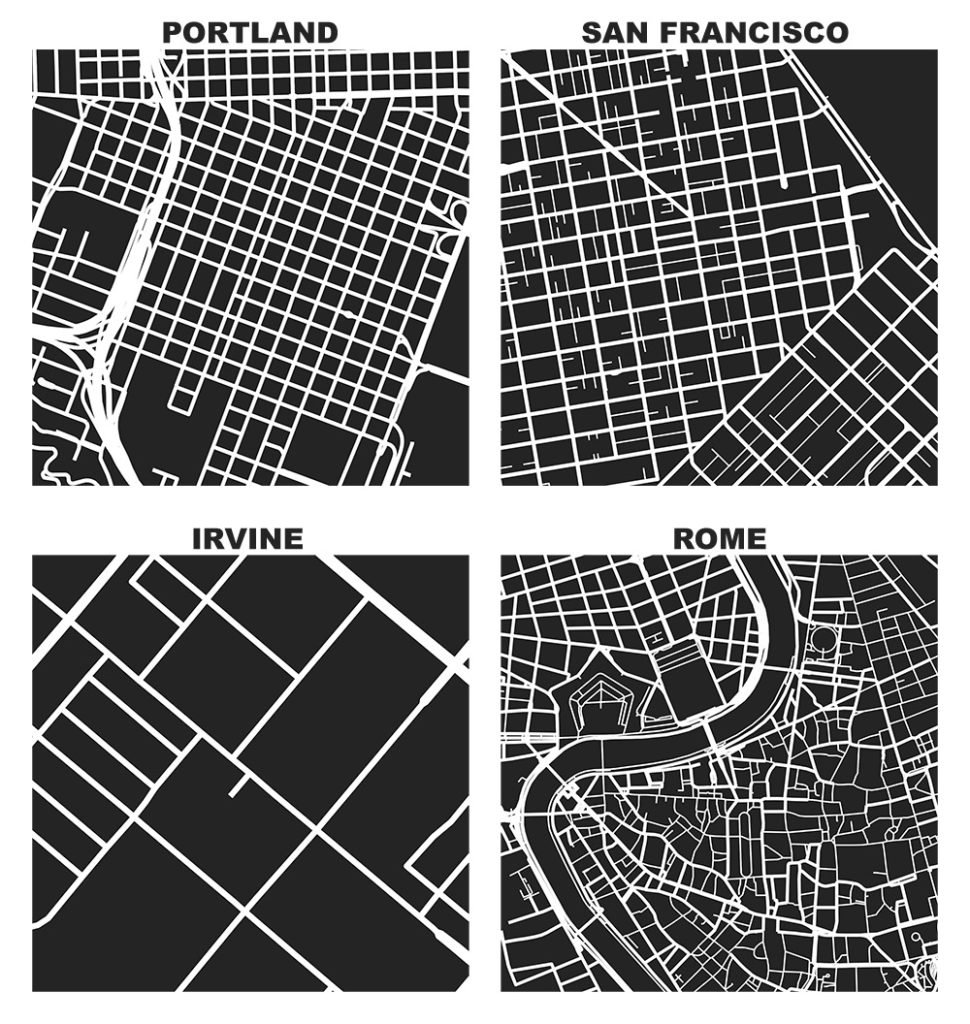
The heart of Allan Jacobs’ classic book on street-level urban form and design, Great Streets, features dozens of hand-drawn figure-ground diagrams in the style of Nolli maps. Each depicts one square mile of a city’s street network. Drawing these cities at the same scale provides a revealing spatial objectivity in visually comparing their street networks and urban forms.

We can recreate these visualizations automatically with Python and the OSMnx package, which I developed as part of my dissertation. With OSMnx we can download a street network from OpenStreetMap for anywhere in the world in just one line of code. Here are the square-mile diagrams of Portland, San Francisco, Irvine, and Rome created and plotted automatically by OSMnx:

OSMnx: Figure-ground diagrams of one square mile of Portland, San Francisco, Irvine, and Rome shows the street network, urban form, and urban design in these cities

Categories
Planning

OSMnx: Python for Street Networks

OSMnx: New York City urban street network visualized and analyzed with Python and OpenStreetMap dataIf you use OSMnx in your work, please cite the journal article.
OSMnx is a Python package to retrieve, model, analyze, and visualize street networks from OpenStreetMap. Users can download and model walkable, drivable, or bikeable urban networks with a single line of Python code, and then easily analyze and visualize them. You can just as easily download and work with amenities/points of interest, building footprints, elevation data, street bearings/orientations, and network routing. If you use OSMnx in your work, please download/cite the paper here.

In a single line of code, OSMnx lets you download, model, and visualize the street network for, say, Modena Italy:

import osmnx as ox
ox.plot_graph(ox.graph_from_place('Modena, Italy'))

OSMnx: Modena Italy networkx street network in Python from OpenStreetMap

Categories
Planning

Craigslist and U.S. Rental Housing Markets

This is a summary of our JPER journal article (available here) about Craigslist rental listings’ insights into U.S. housing markets.

Small map of 1.5 million Craigslist rental listings in the contiguous U.S., divided into quintiles by each listing's rent per square footRentals make up a significant portion of the U.S. housing market, but much of this market activity is poorly understood due to its informal characteristics and historically minimal data trail. The UC Berkeley Urban Analytics Lab collected, validated, and analyzed 11 million Craigslist rental listings to discover fine-grained patterns across metropolitan housing markets in the United States. I’ll summarize our findings below and explain the methodology at the bottom.

But first, 4 key takeaways:

  1. There are incredibly few rental units below fair market rent in the hottest housing markets. Some metro areas like New York and Boston have only single-digit percentages of Craigslist rental listings below fair market rent. That’s really low.
  2. This problem doesn’t exclusively affect the poor: the share of its income that the typical household would spend on the typical rent in cities like New York and San Francisco exceeds the threshold for “rent burden.”
  3. Rents are more “compressed” in soft markets. For example, in Detroit, most of the listed units are concentrated within a very narrow band of rent/ft² values, but in San Francisco rents are much more dispersed. Housing vouchers may end up working very differently in high-cost vs low-cost areas.
  4. Craigslist listings correspond reasonably well with Dept of Housing and Urban Development (HUD) estimates, but provide up-to-date data including unit characteristics, from neighborhood to national scales. For example, we can see how rents are changing, neighborhood by neighborhood, in San Francisco in a given month.
Categories
Planning

How to Visualize Urban Accessibility and Walkability

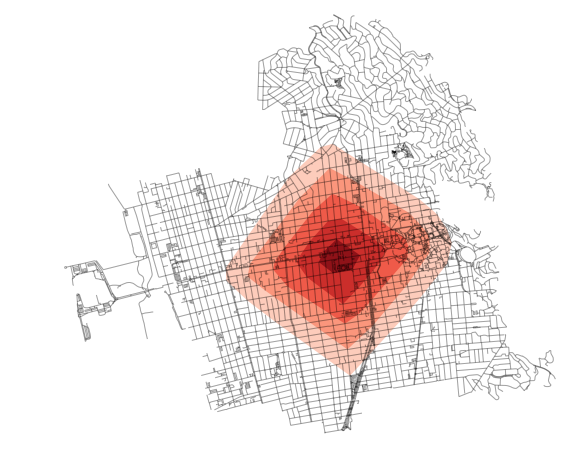
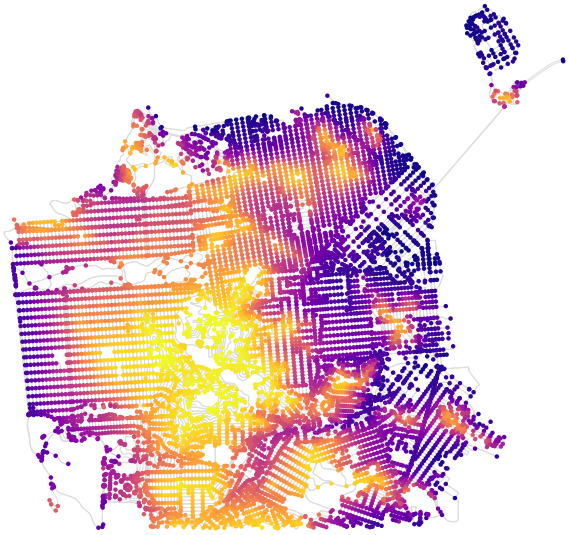
Tools like WalkScore visualize how “walkable” a neighborhood is in terms of access to different amenities like parks, schools, or restaurants. It’s easy to create accessibility visualizations like these ad hoc with Python and its pandana library. Pandana (pandas for network analysis – developed by Fletcher Foti during his dissertation research here at UC Berkeley) performs fast accessibility queries over a network. I’ll demonstrate how to use it to visualize urban walkability. My code is in these IPython notebooks in this urban data science course GitHub repo.

First I give pandana a bounding box around Berkeley/Oakland in the East Bay of the San Francisco Bay Area. Then I load the street network and amenities from OpenStreetMap. In this example I’ll look at accessibility to restaurants, bars, and schools. But, you can create any basket of amenities that you are interested in – basically visualizing a personalized “AnythingScore” instead of a generic WalkScore for everyone. Finally I calculate and plot the distance from each node in the network to the nearest amenity:

Berkeley Oakland California street network walking accessibility and walkability

Categories
Planning

Urban Design and Complexity

Corbusier Paris planI am presenting at the 2015 Conference on Complex Systems tomorrow in Tempe, Arizona. My paper is on methods for assessing the complexity of urban design. If you’re attending the conference, come on by!

Here’s the paper.

Here’s the abstract:

Categories
Travel

The Beautiful Cities of Eastern Europe

Western Europe gets all the attention, but that means it also gets all the tourists. Here are some of my favorite old cities that I’ve visited on the other side of the continent, along with a few photos I took while there. Granted, a few of these places are now squarely on the backpacker circuit, but many remain underexplored. What they all share is an incredible, exhilarating sense of urbanism — old and new.

Eastern Europe itself is hard to define. Competing designations might include only the former Soviet states, or all the formerly communist European nations. Others might separate a limited Eastern Europe out from Central and Southeastern Europe. Here I will play fast and loose with the geographic boundaries: these are just cities somewhere vaguely toward the eastern side of the continent. Apologies to any readers whose country is usually considered a part of Central or Southern Europe.

First up: Mostar. A small city in the south of Bosnia and Herzegovina, Mostar is most famous for its medieval Ottoman center and its Old Bridge, or Stari Most:

Stari Most old bridge in Mostar, Bosnia and Herzegovina

Categories
Travel

Hong Kong at Night

Hong Kong is a remarkable place. It is the 4th-densest sovereign state or self-governing territory in the world (in 1st place is its neighbor across the delta: Macau). Yet this density is fantastically constrained by the mountains and the sea into narrow, snaking corridors of high-rises wherever the terrain permits. At no time is this unique urban development better seen than at night, when Hong Kong lights up like a carnival.

I took these photos from the top of Victoria Peak on Hong Kong island and from the Tsim Sha Tsui promenade on the Kowloon peninsula, using long exposures of between 3 and 12 seconds.

hong-kong-skyline-night-2

Categories
Planning

LEED-ND and Neighborhood Livability

I recently co-authored a journal article titled LEED-ND and Livability Revisited, which won the Kaye Bock award. LEED-ND is a system for evaluating neighborhood design that was developed by CNU, USGBC, and NRDC. Many of its criteria, particularly site location and neighborhood pattern, accordingly reflect New Urbanist and Smart Growth principles and are inspired by traditional neighborhood design.

Categories
Academia

The Inside Field Exam and Urban Complexity

I recently completed my inside field exam, one of the many steps involved in advancing to candidacy. The three professors on your inside field committee send you six questions – a pair per professor – and you are given 72 hours total to answer one question from each pair. The answers are to be in the form of a scholarly article with thorough citations. Long story short, you’ve got to write 30 pages of academic scholarship in three days.

The exam questions themselves are very interesting. The professors construct them based on their reading of your inside field statement, trying to probe areas that might be particularly rich or a bit weak in the statement. Here are the questions I answered:

Categories
Planning

How Our Neighborhoods Lost Local Food (And How They Can Get It Back)

Healthy-foodThis post is adapted from an article I wrote in Progressive Planning.

Does food matter in neighborhood design? Should it? The answers to these questions are complicated and obscured by decades of perplexing policy and practice. There are many benefits of good food – that is, food which is healthy, affordable, fair, and sustainable. Proper nourishment has been linked in several studies to better classroom performance. Walkable access to healthy food can reduce America’s growing obesity and diabetes epidemics. Locally-sourced food can reinforce better dietary habits as consumers connect with the value chain and see eating as a more natural process.

The benefits are straightforward, but do most American neighborhoods actually support healthy food access?