Categories
Urban

Street Network Simplification

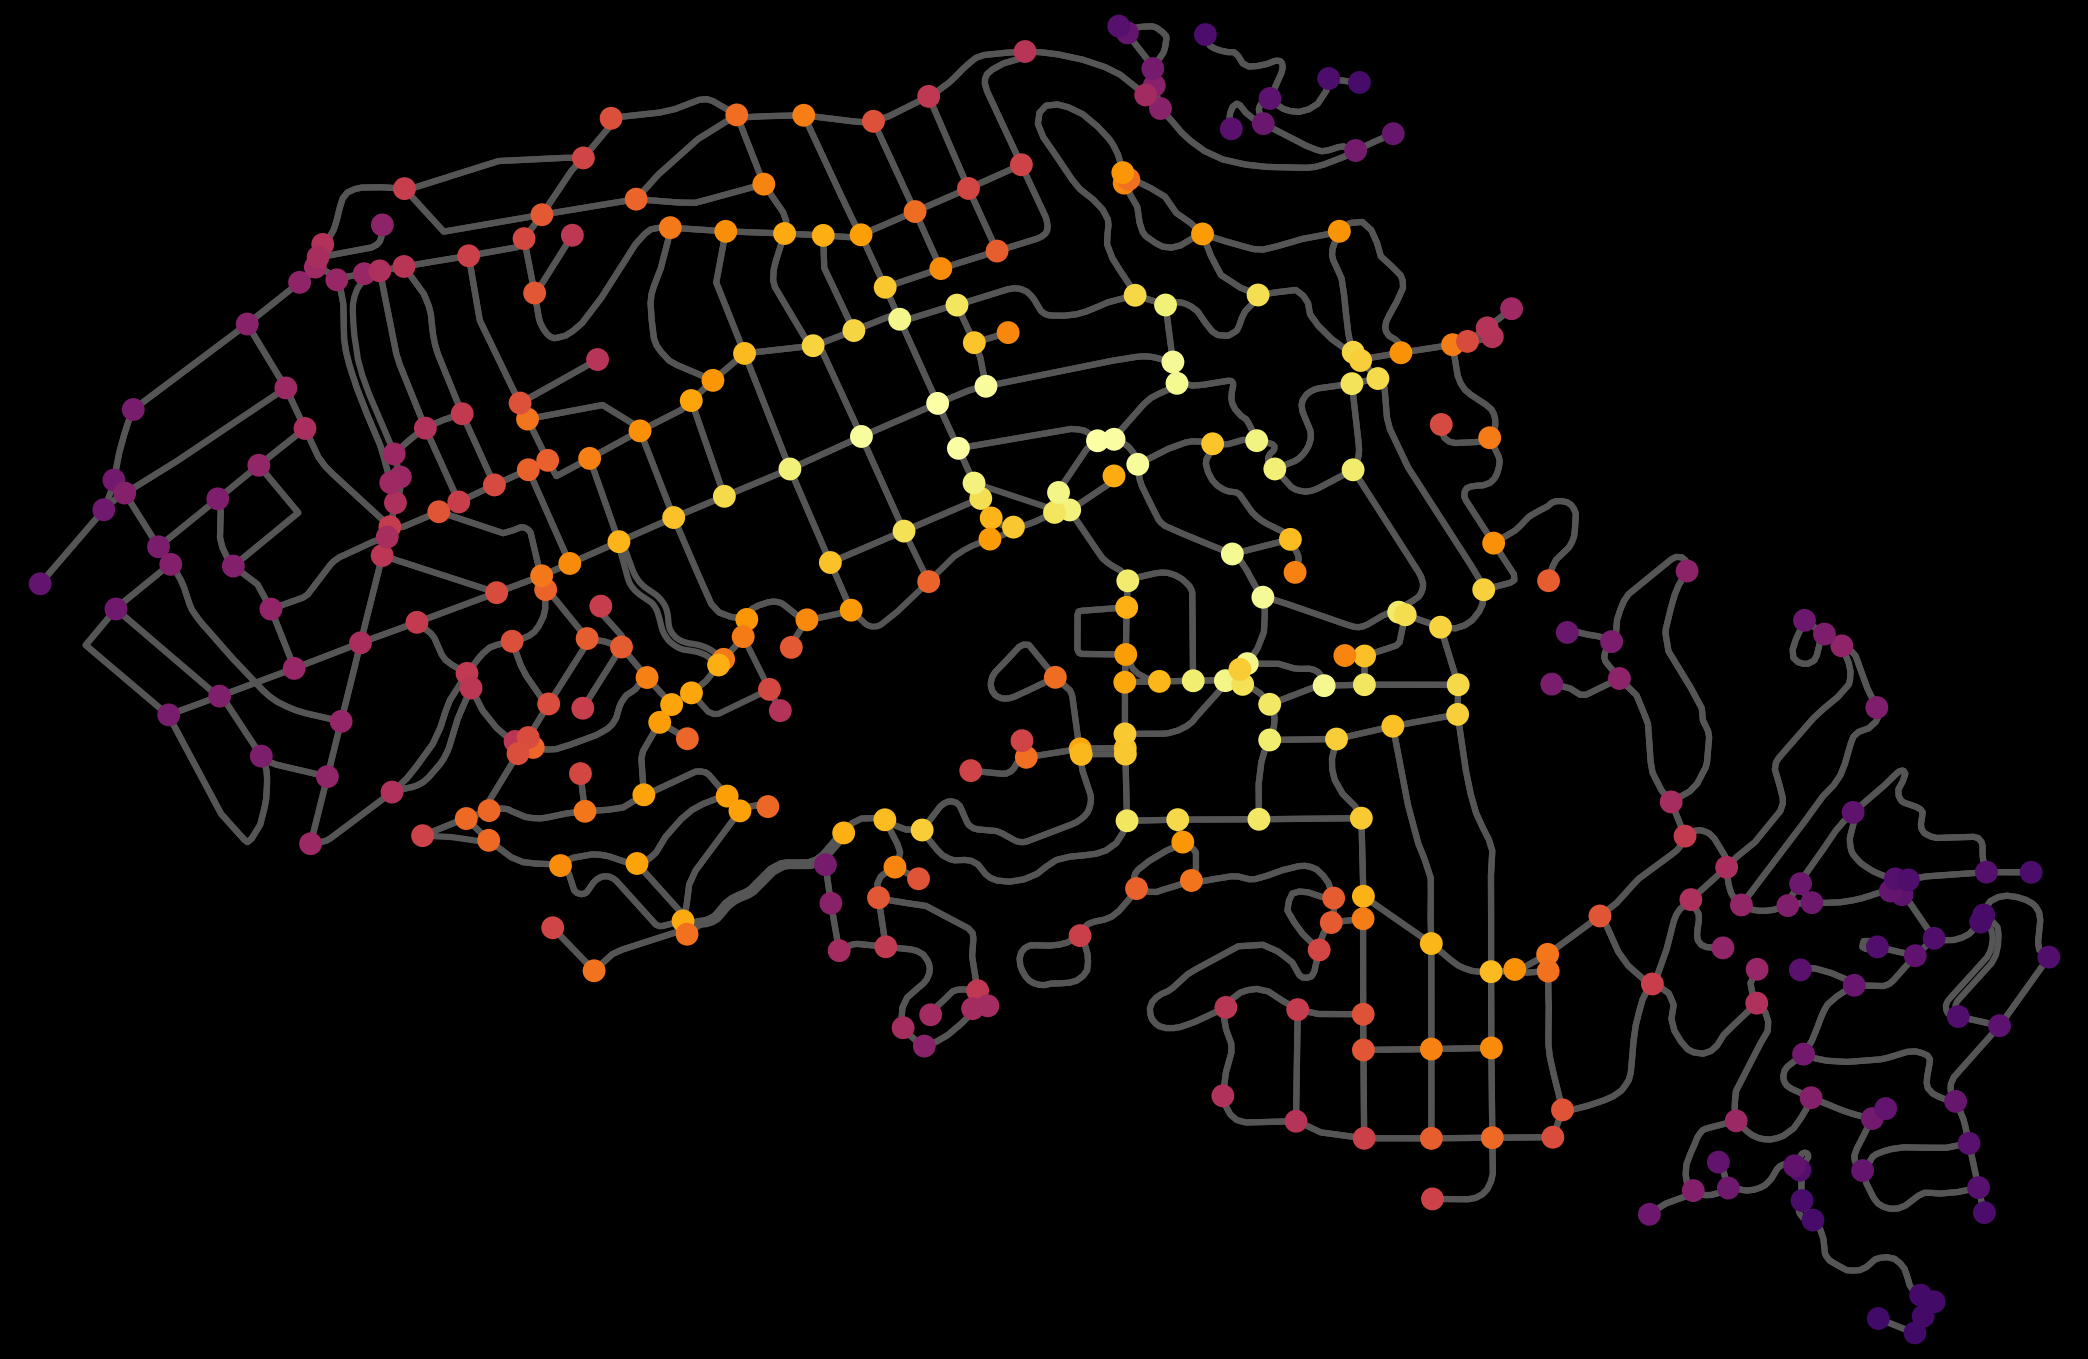
How many street intersections do you see in this figure? I have a new article published this week in Transactions in GIS (open-access) and its first sentence sums it up: “Counting is hard.” Hear me out… it really is!

Street network graph simplification of complex intersections, nonplanarity, and curve digitization from OpenStreetMap dataMost real-world objects belong to fuzzy categories, resulting in subjective decisions about what to include or exclude from counts. Yet this complexity is often obscured by a superficial impression that counting is easy to do because its mechanics seem easy to understand. After all, everyone learns to count in kindergarten by simply enumerating the elements in a set. But counting is hard because defining that set and identifying its members are often nontrivial tasks. Many of the world’s most important analytics rely far less on flashy data science techniques than they do on counting things well and justifying those counts effectively.

Street intersection counts and densities are ubiquitous measures in transportation geography and planning. However, typical street network data and typical street network analysis tools can substantially overcount them. This article explains the 3 main reasons why this happens and presents solutions to each.

Street intersections, particularly the complex kind common in modern car-centric urban areas, are fuzzy objects for which most data sources do not provide a simple 1:1 representation. This results in spatial uncertainty due to data challenges in representing network nonplanarity, intersection complexity, and curve digitization. Essentially all data sources suffer from at least 1 of these problems due to difficulties representing divided roads, slip lanes, roundabouts, interchanges, complex turning lanes, etc. If unaddressed, my assessment shows that typical intersection counts (and downstream densities) would be overestimated by >14%, but very unevenly so in different parts of the world. This bias’s extreme heterogeneity particularly hinders comparative urban analytics.Street network topology simplification with OSMnx and OpenStreetMapMitigating these 3 problems is a project I’ve been iteratively refining for the past decade. It was a central focus of my dissertation and a key motivation for originally developing OSMnx. This article presents OSMnx’s algorithms to automatically simplify spatial graphs of urban street networks—via edge simplification and node consolidation—resulting in faster parsimonious models and more accurate network measures like intersection counts and densities, street segment lengths, and node degrees. These algorithms’ information compression drastically improves downstream graph analytics’ memory and runtime efficiency, boosting analytical tractability without loss of model fidelity.

Counting is hard, but we can make it a little easier by using better models. For more, check out the open-access article.

Categories
Academia

Surfacic Networks

I recently coauthored an article titled “Surfacic Networks” in PNAS Nexus with Marc Barthelemy, Alain Chiaradia, and Chris Webster. We propose the concept of surfacic networks to describe a class of spatial networks embedded in non-flat two-dimensional manifolds (e.g., the Earth’s surface), and what this means for distance metrics and lazy path solving when accounting for fluctuations in the manifold’s curvature (e.g., changes in elevation on Earth’s surface).

Surfacic network: a spatial network embedded in a non-flat two-dimensional manifold such as the Earth's surface accounting for elevation changesFrom the abstract:

Surfacic networks are structures built upon a 2D manifold. Many systems, including transportation networks and various urban networks, fall into this category. The fluctuations of node elevations imply significant deviations from typical plane networks and require specific tools to understand their impact. Here, we present such tools, including lazy paths that minimize elevation differences, graph arduousness which measures the tiring nature of shortest paths (SPs), and the excess effort, which characterizes positive elevation variations along SPs. We illustrate these measures using toy models of surfacic networks and empirically examine pedestrian networks in selected cities. Specifically, we examine how changes in elevation affect the spatial distribution of betweenness centrality. We also demonstrate that the excess effort follows a nontrivial power law distribution, with an exponent that is not universal, which illustrates that there is a significant probability of encountering steep slopes along SPs, regardless of the elevation difference between the starting point and the destination. These findings highlight the significance of elevation fluctuations in shaping network characteristics. Surfacic networks offer a promising framework for comprehensively analyzing and modeling complex systems that are situated on or constrained to a surface environment.

For more, check out the article.

Categories
Urban

Urban Street Network Orientation

My new article, Urban Spatial Order: Street Network Orientation, Configuration, and Entropy, has just been published in one of my favorite journals: Applied Network Science (download free PDF). This study explores the spatial signatures of urban evolution and central planning. It examines street network orientation, connectivity, granularity, and entropy in 100 cities around the world using OpenStreetMap data and OSMnx for modeling and visualization:

City street network grid orientations, order, disorder, entropy, rose plot, polar histogram made with Python, OSMnx, OpenStreetMap, matplotlib.

So, who’s got a grid and who doesn’t? Each of the cities above is represented by a polar histogram (aka rose diagram) depicting how its streets orient. Each bar’s direction represents the compass bearings of the streets (in that histogram bin) and its length represents the relative frequency of streets with those bearings. The cities above are in alphabetical order. Here they are again, re-sorted from most-ordered/gridded city (Chicago) to most-disordered (Charlotte):

Categories
Data

US Street Network Models and Measures

My new article, “Street Network Models and Measures for Every U.S. City, County, Urbanized Area, Census Tract, and Zillow-Defined Neighborhood” has been published in Urban Science. This paper reports results from a broader project that collected raw street network data from OpenStreetMap using the Python-based OSMnx software for every U.S. city and town, county, urbanized area, census tract, and Zillow-defined neighborhood boundary. It constructed nonplanar directed multigraphs for each and analyzed their structural and morphological characteristics.

The resulting public data repository contains over 110,000 processed, cleaned street network graphs (which in turn comprise over 55 million nodes and over 137 million edges) at various scales—comprehensively covering the entire U.S.—archived as reusable open-source GraphML files, node/edge lists, and ESRI shapefiles that can be immediately loaded and analyzed in standard tools such as ArcGIS, QGIS, NetworkX, graph-tool, igraph, or Gephi.

Categories
Data

Street Network Analysis in a Docker Container

Containerization is the way of the future present. I’ve heard feedback from some folks over the past few months who would like to play around with OSMnx for street network analysis, transport modeling, and urban design—but can’t because they can’t install Python and its data science stack on their computers. Furthermore, it would be nice to have a consistent reference environment to deploy on AWS or elsewhere in the cloud.

So, I’ve created a docker image containing OSMnx, Jupyter, and the rest of the Python geospatial data science stack, available on docker hub alongside additional usage instructions. If you’re starting from scratch, you can get started in four simple steps:

Categories
Planning

New Chapter: Street Network Morphology

My chapter The Morphology and Circuity of Walkable and Drivable Street Networks is now in-press for publication in the forthcoming book The Mathematics of Urban Morphology (download free PDF). The book integrates recent theoretical and empirical work from urban planning, geography, sociology, architecture, economics, and mathematics around the theme of how we model and understand the urban form’s physical patterns and shaping processes. Fellow authors in this volume include Michael Batty, Diane Davis, Keith Clarke, Bin Jiang, Kay Axhausen, Carlo Ratti, and Stephen Marshall. The book itself can be purchased here.

Categories
Planning

New Article: Planar Models of Street Networks

My article, “Planarity and Street Network Representation in Urban Form Analysis,” was recently published in Environment and Planning B: Urban Analytics and City Science. Models of street networks underlie research in urban travel behavior, accessibility, design patterns, and morphology. These models are commonly defined as planar, meaning they can be represented in two dimensions without any underpasses or overpasses. However, real-world urban street networks exist in three-dimensional space and frequently feature grade separation such as bridges and tunnels: planar simplifications can be useful but they also impact the results of real-world street network analysis. This study measures the nonplanarity of drivable and walkable street networks in the centers of 50 cities worldwide, then examines the variation of nonplanarity across a single city. While some street networks are approximately planar, I empirically quantify how planar models can inconsistently but drastically misrepresent intersection density, street lengths, routing, and connectivity.

Categories
Urban

New Article: Complexity in Urban Form and Design

My article, Measuring the Complexity of Urban Form and Design, is now in-press for publication at Urban Design International (download free PDF). Cities are complex systems composed of many human agents interacting in physical urban space. This paper develops a typology of measures and indicators for assessing the physical complexity of the built environment at the scale of urban design. It extends quantitative measures from city planning, network science, ecosystems studies, fractal geometry, statistical physics, and information theory to the analysis of urban form and qualitative human experience.

The Mandelbrot set, a mathematical fractal. Venice's fractal urban form and fabric. The Eiffel Tower's fractal architecture in Paris.

Categories
Data

Urban Street Network Centrality

Check out the journal article about OSMnx.

We can measure and visualize how “important” a node or an edge is in a network by calculating its centrality. Lots of flavors of centrality exist in network science, including closeness, betweenness, degree, eigenvector, and PageRank. Closeness centrality measures the average shortest path between each node in the network and every other node: more central nodes are closer to all other nodes. We can calculate this easily with OSMnx, as seen in this GitHub demo. For example, here is the node closeness centrality for Piedmont, California:

Urban street network graph node closeness and betweenness centrality

Categories
Data

Animating the Lorenz Attractor with Python

Edward Lorenz, the father of chaos theory, once described chaos as “when the present determines the future, but the approximate present does not approximately determine the future.”

Lorenz first discovered chaos by accident while developing a simple mathematical model of atmospheric convection, using three ordinary differential equations. He found that nearly indistinguishable initial conditions could produce completely divergent outcomes, rendering weather prediction impossible beyond a time horizon of about a fortnight.

Lorenz system attractor animated GIF created with Python matplotlib scipy numpy PIL