This post is part of a series on visualizing data from my summer travels.
Oscar Levant once said, darkly, that “happiness isn’t something you experience; it’s something you remember.” We humans have a way of constructing and reconstructing experiences and memories through the methods by which we recall them. The endlessly repeated anecdote from your vacation in Italy eventually becomes emblematic of the larger trip. The photograph on the wall from your wedding day becomes a synecdoche for the entire event.
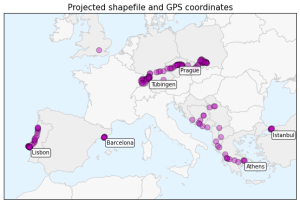
I spent the past two months in Europe and documented my travels through a set of photographs which have become emblematic, for me, of packages of experiences from different places. However, they are often skewed and selective, telling only one deliberate perspective of a wider, richer experience. Another way to remember and reminisce about one’s travels is through maps. Where did I go? What path did I take? How did the parts of the trip fit together? The answers to these questions are useful in revealing another perspective of the larger experience.
 This guide was written in 2014 and updated slightly in November 2020.