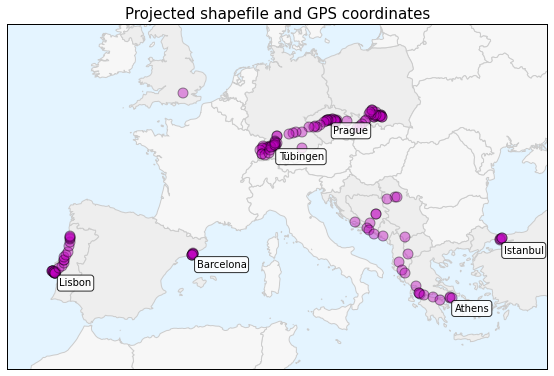
 This is a series of posts about visualizing spatial data. I spent a couple of months traveling in Europe this summer and collected GPS location data throughout the trip with the OpenPaths app. I explored different web mapping technologies such as CartoDB, Leaflet, Mapbox, and Tilemill to plot my travels. I also used Python and matplotlib to run some descriptive statistics and visualize other aspects of my trip.
Here is the series of posts:
- Part 1: introduction and data collection with OpenPaths
- Part 2: interactive web maps with CartoDB
- Part 3: interactive javascript web maps with Leaflet
- Part 4: interactive tiled web maps with Mapbox and Tilemill
- Part 5: visualizing data with Python and matplotlib
- Part 6: projecting spatial data and making beautiful maps with Python
My Python code is available in this GitHub repo. I also did some more involved work under the hood to prep the data and support these visualizations. For example, in the following posts I reverse-geocoded the spatial data set and reduced its size with clustering algorithms and the Douglas-Peucker algorithm: