Last.fm is a web site that tracks your music listening history across devices (computer, phone, iPod, etc) and services (Spotify, iTunes, Google Play, etc). I’ve been using Last.fm for nearly 10 years now, and my tracked listening history goes back even further when you consider all my pre-existing iTunes play counts that I scrobbled (ie, submitted to my Last.fm database) when I joined Last.fm.
Using Python, pandas, matplotlib, and leaflet, I downloaded my listening history from Last.fm’s API, analyzed and visualized the data, downloaded full artist details from the Musicbrainz API, then geocoded and mapped all the artists I’ve played. All of my code used to do this is available in this GitHub repo, and is easy to re-purpose for exploring your own Last.fm history. All you need is an API key.
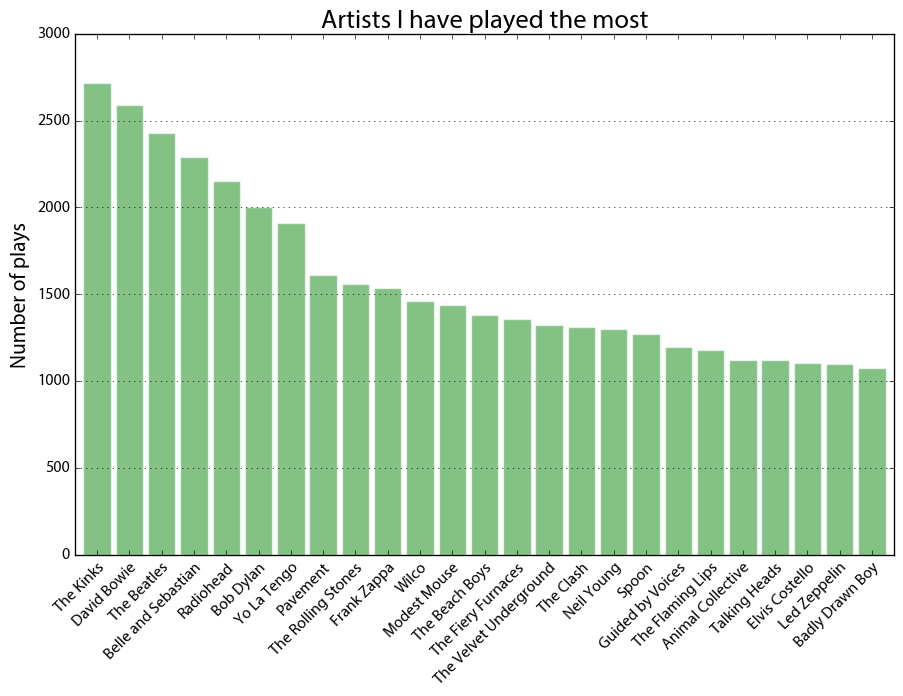
First I visualized my most-played artists, above. Across the dataset, I have 279,769 scrobbles (aka, song plays). I’ve listened to 26,761 different artists and 66,377 different songs across 38,026 different albums from when I first started using iTunes circa 2005 through the present day. This includes pretty close to every song I’ve played on anything other than vinyl during that time.
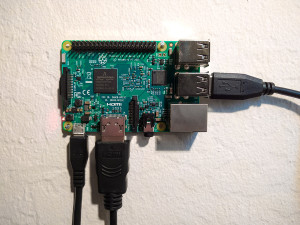 A guide to setting up the Python scientific stack, well-suited for geospatial analysis, on a Raspberry Pi 3. The whole process takes just a few minutes.
 interactive web maps. To do this, we use the Python programming language, open source analysis and visualization tools, and public data.