My article “OSMnx: New methods for acquiring, constructing, analyzing, and visualizing complex street networks” was published in the journal Computers, Environment and Urban Systems earlier this month. OSMnx is a Python package that lets you download a street network anywhere in the world at any scale with a single line of code, then analyze or visualize it with one more line of code.
Tag: design
Isochrone Maps with OSMnx + Python
Check out the journal article about OSMnx.
How far can you travel on foot in 15 minutes? Urban planners use isochrone maps to show spatial horizons (i.e., isolines) that are equal in time. Isochrones depict areas according to how long it takes to arrive there from some point. These visualizations are particularly useful in transportation planning as they reveal what places are accessible within a set of time horizons.
We can create isochrone maps for anywhere in the world automatically with Python and its OSMnx package:
OSMnx and Street Network Elevation Data
Check out the journal article about OSMnx.
OSMnx can now download street network elevation data for anywhere in the world. In one line of code it downloads the elevation in meters of each network node, and in one more line of code it can calculate every street (i.e., edge) grade. Here is the complete street network of San Francisco, California, with nodes colored according to their elevation:
Check out the journal article about OSMnx. This is a summary of some of my recent research on making OpenStreetMap data analysis easy for urban planners. It was also published on the ACSP blog.
OpenStreetMap – a collaborative worldwide mapping project inspired by Wikipedia – has emerged in recent years as a major player both for mapping and acquiring urban spatial data. Though coverage varies somewhat worldwide, its data are of high quality and compare favorably to CIA World Factbook estimates and US Census TIGER/Line data. OpenStreetMap imported the TIGER/Line roads in 2007 and since then its community has made numerous corrections and improvements. In fact, many of these additions go beyond TIGER/Line’s scope, including for example passageways between buildings, footpaths through parks, bike routes, and detailed feature attributes such as finer-grained street classifiers, speed limits, etc.
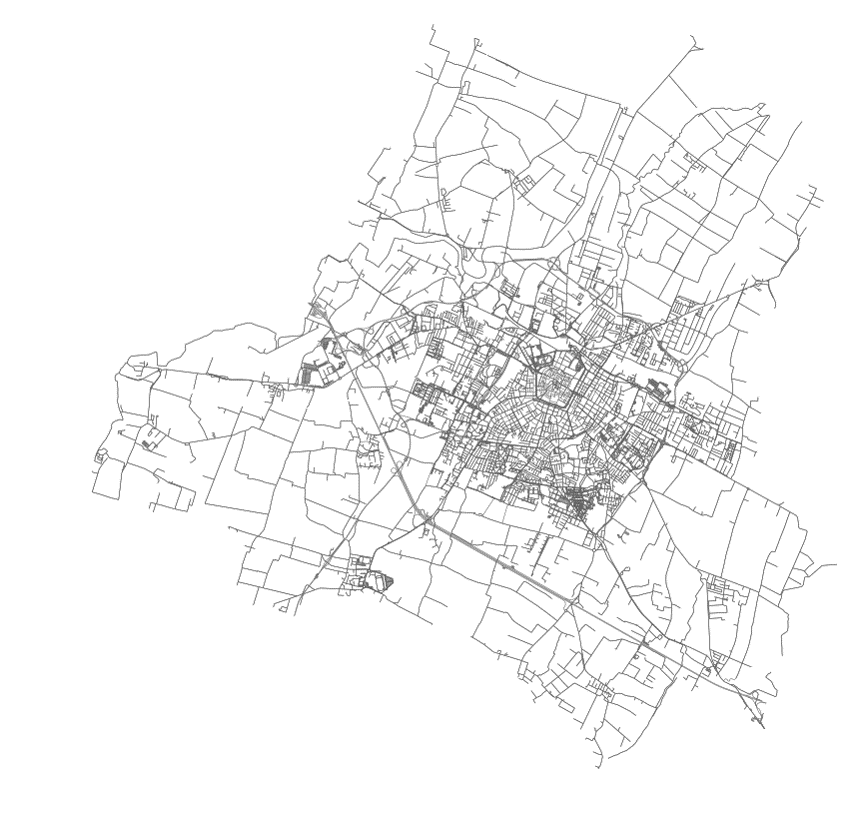
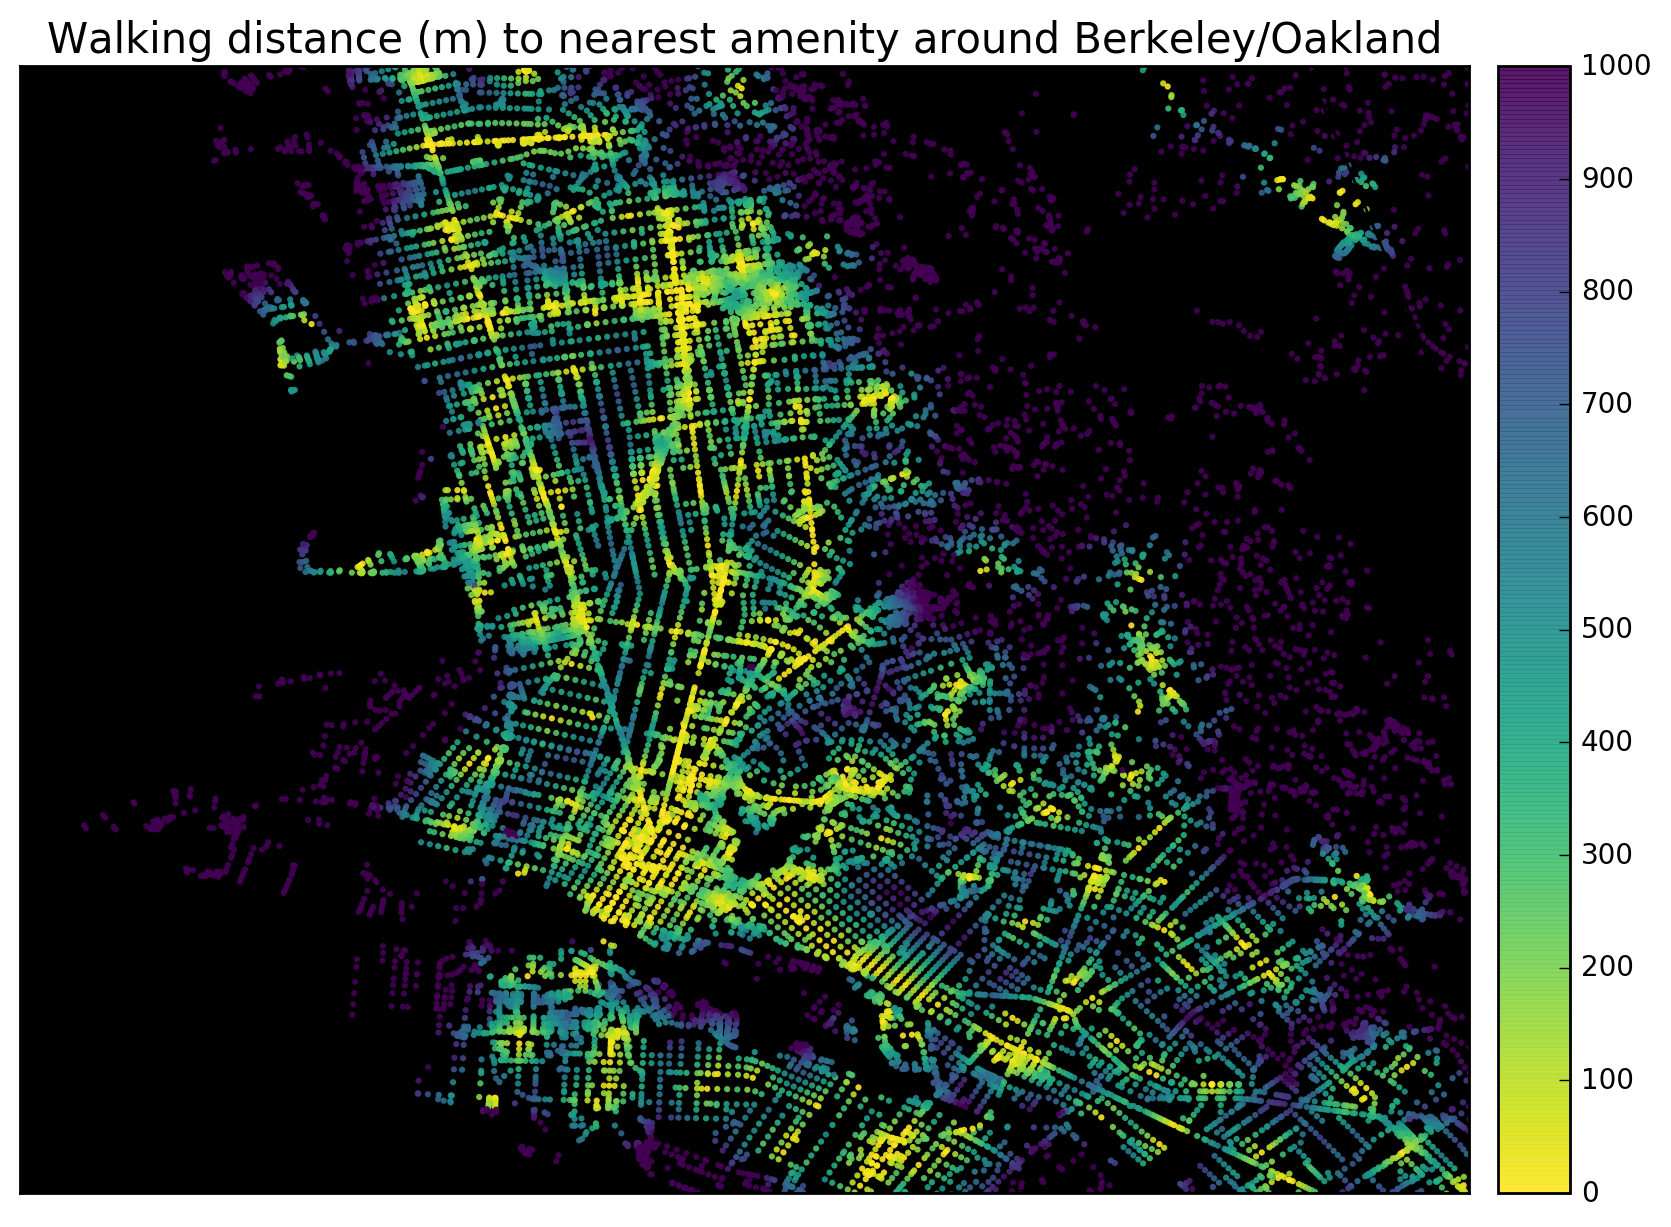
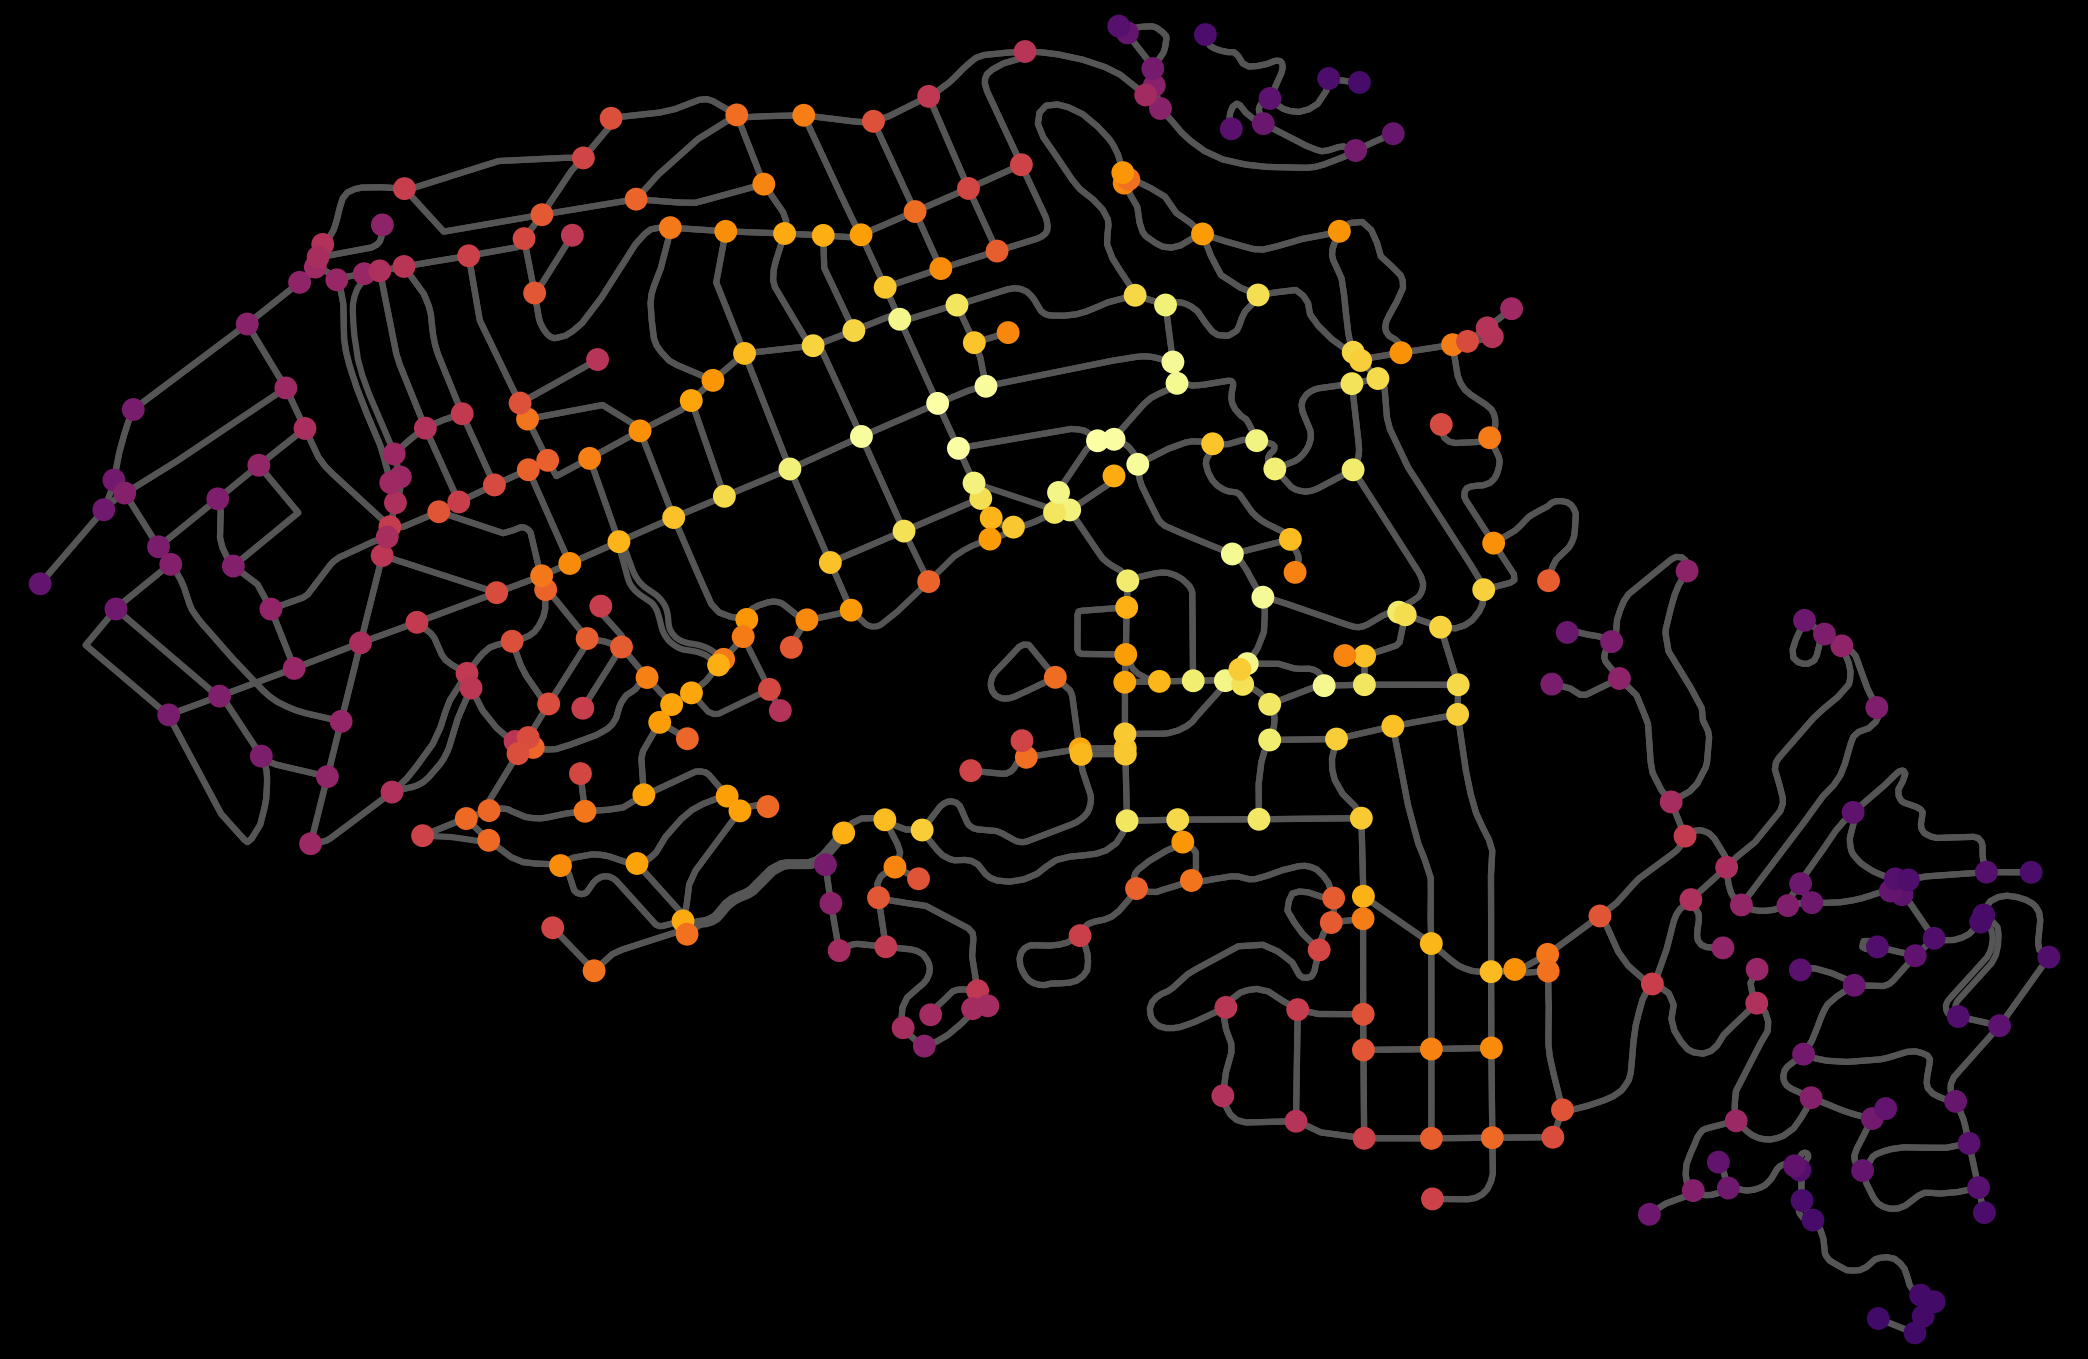
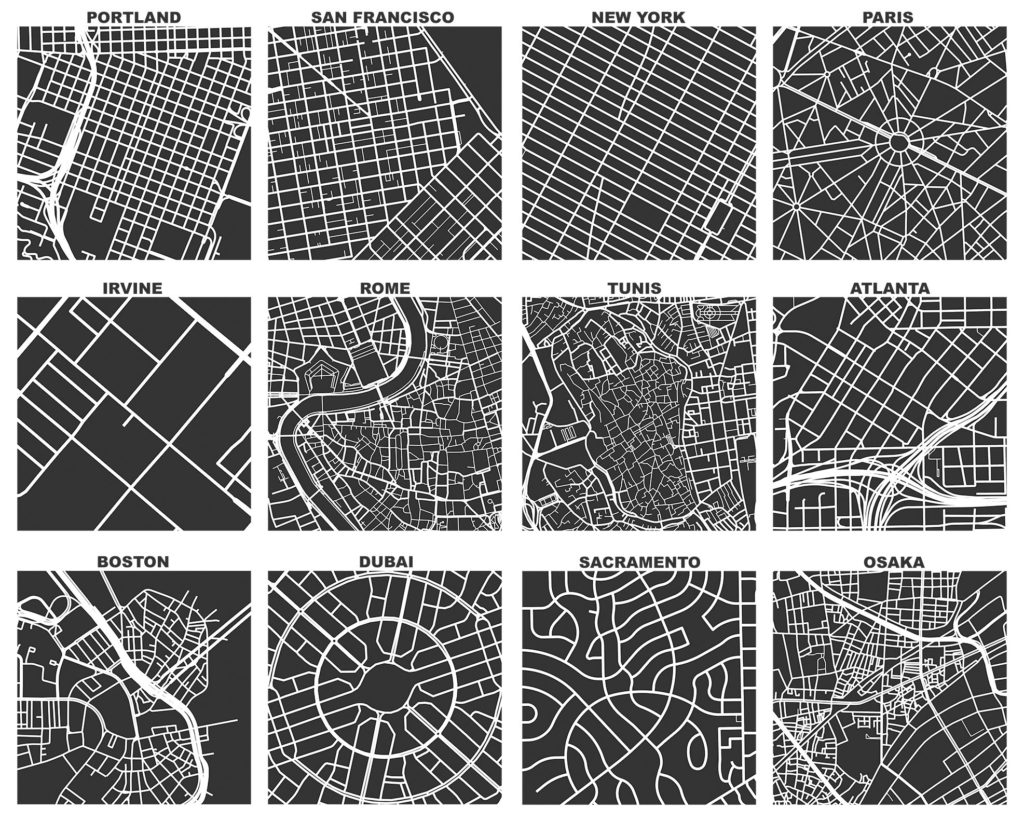
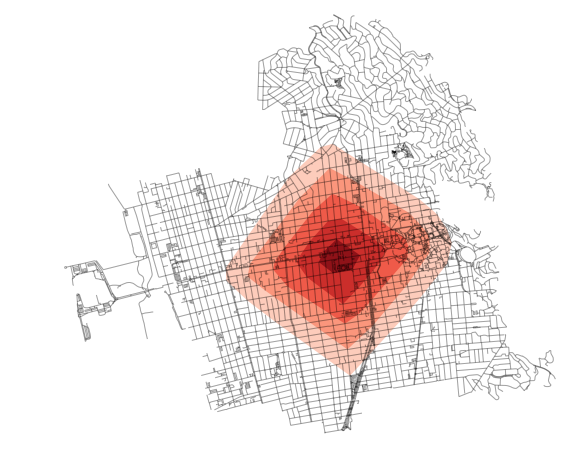
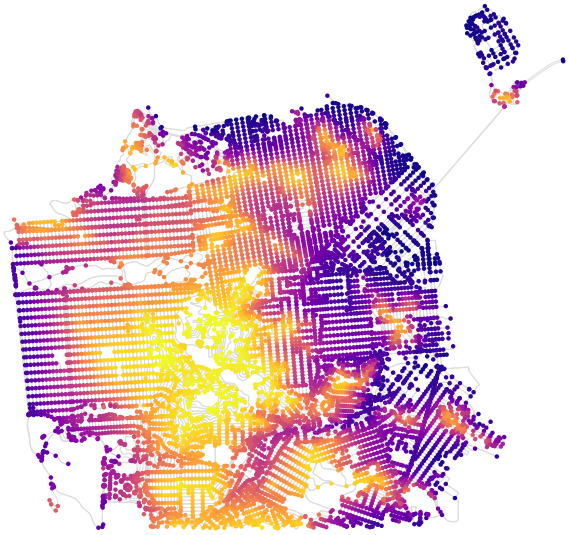
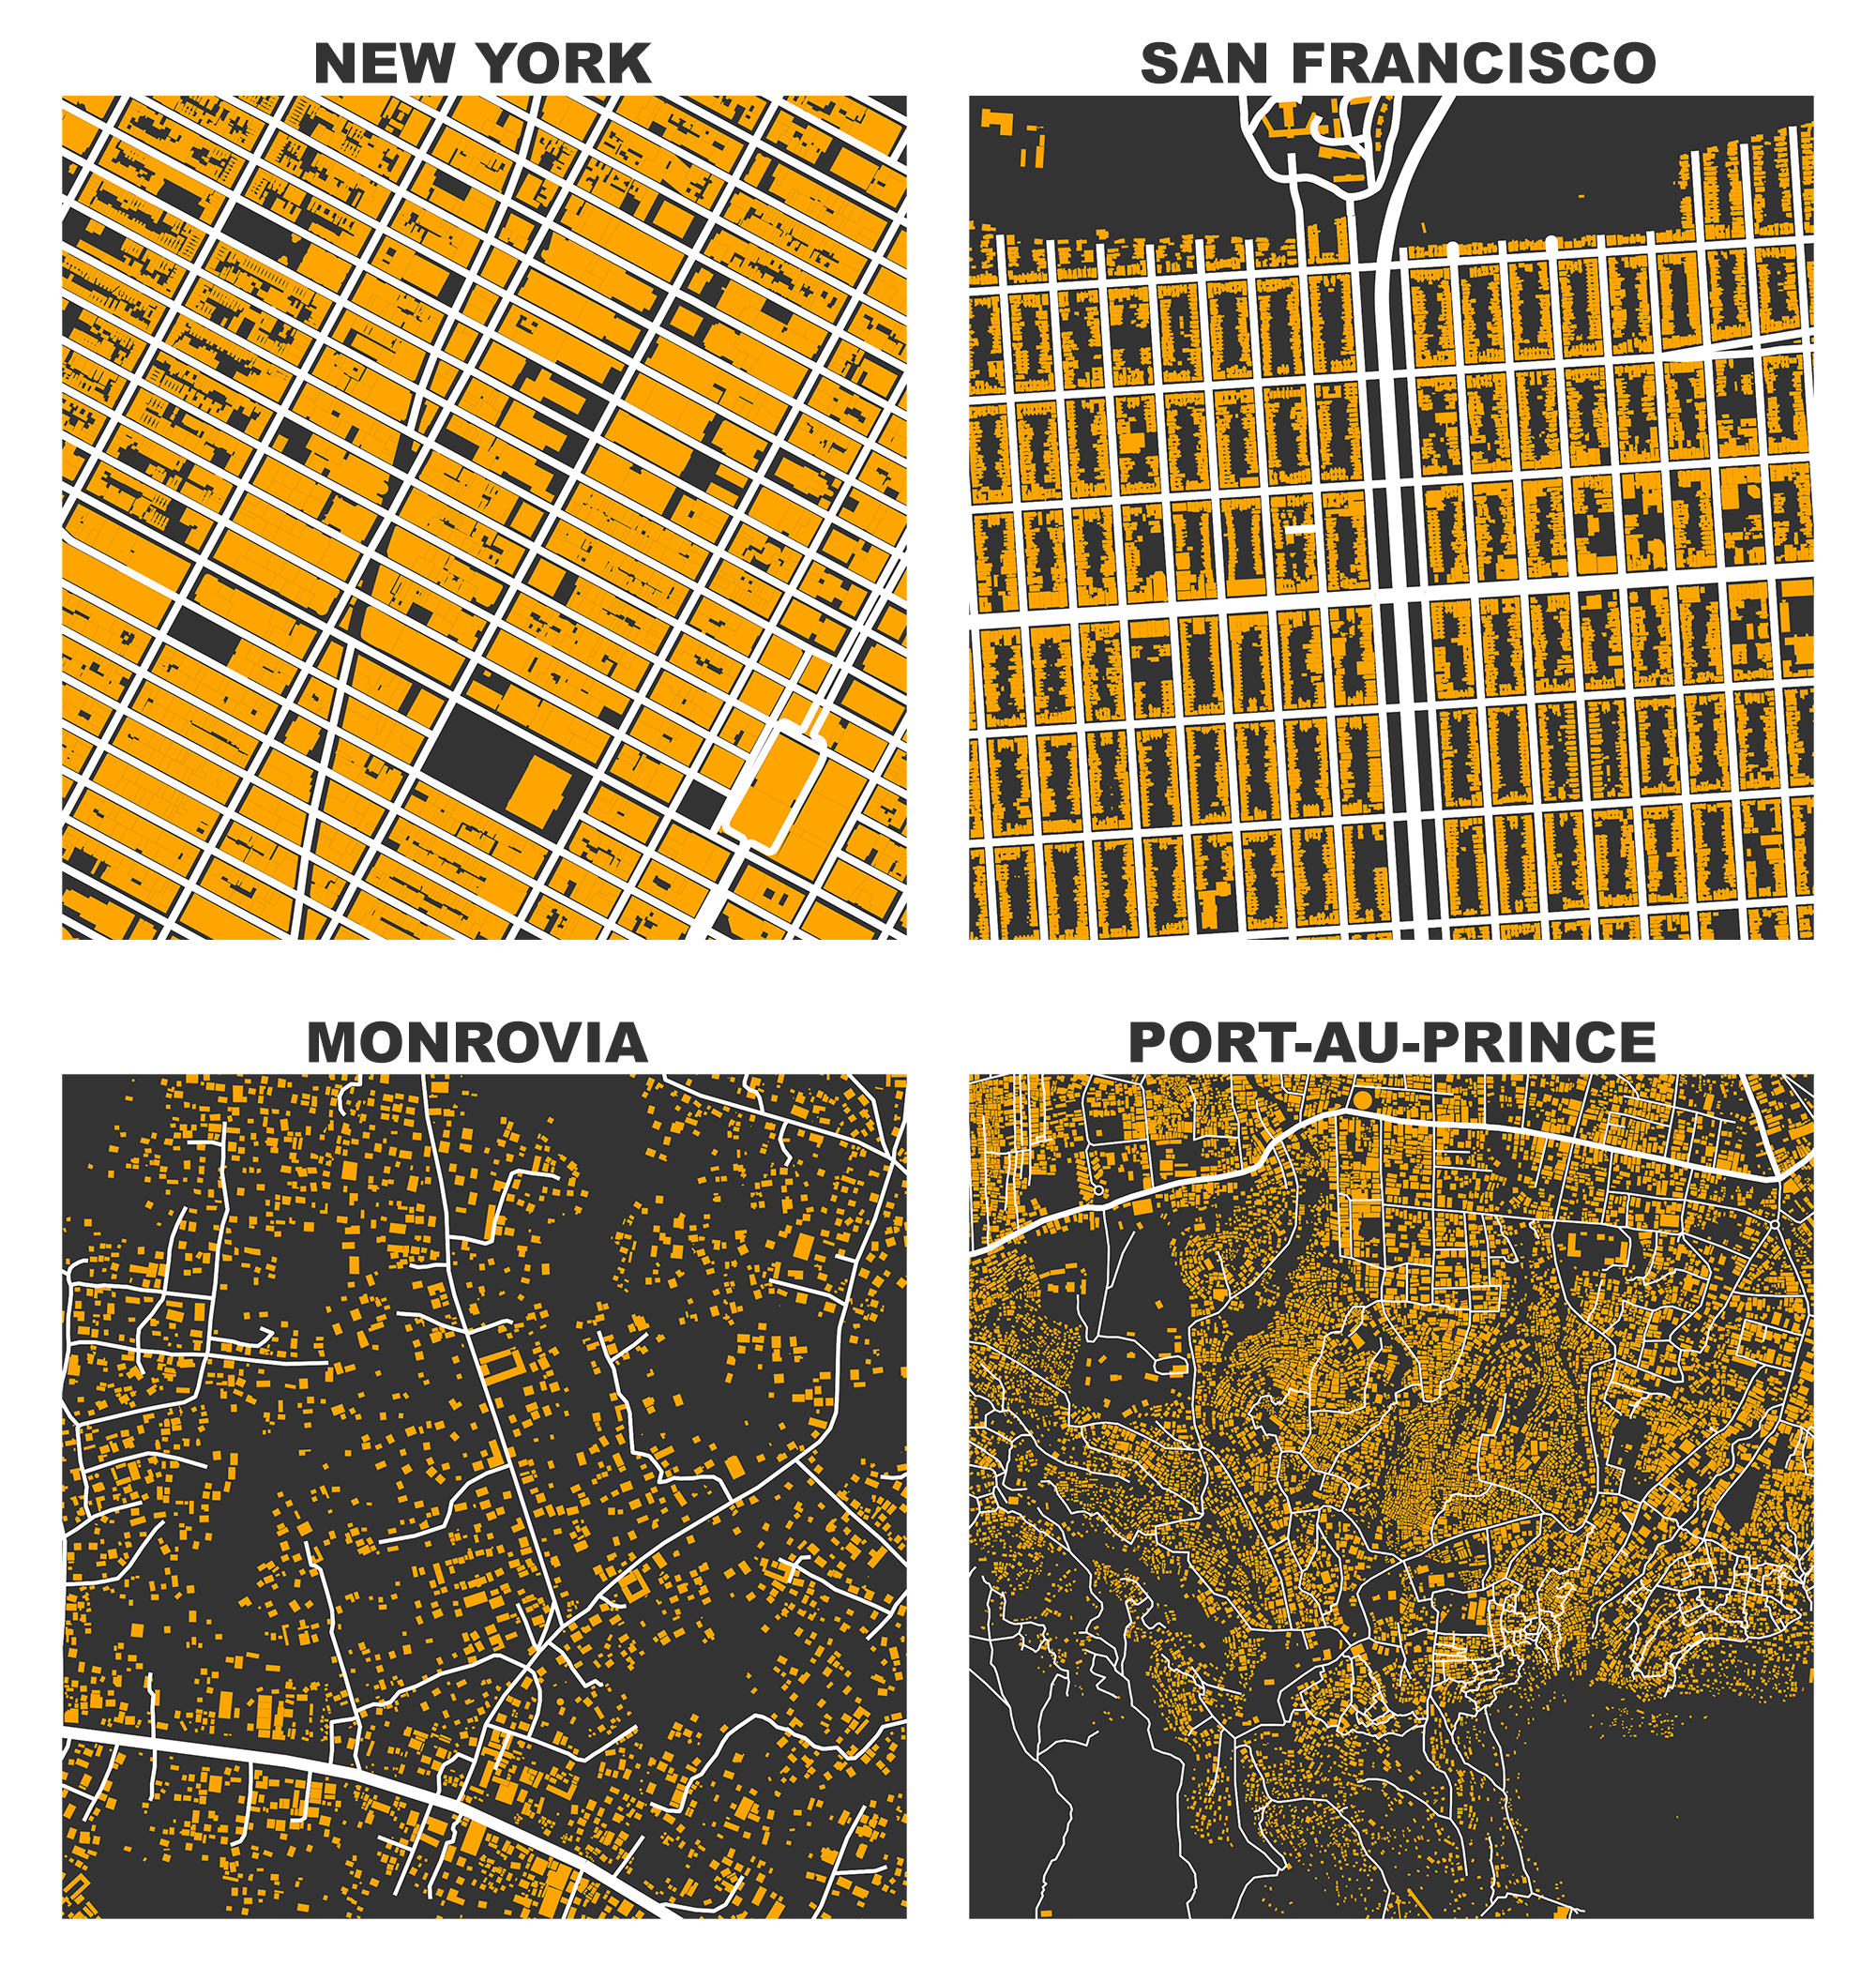
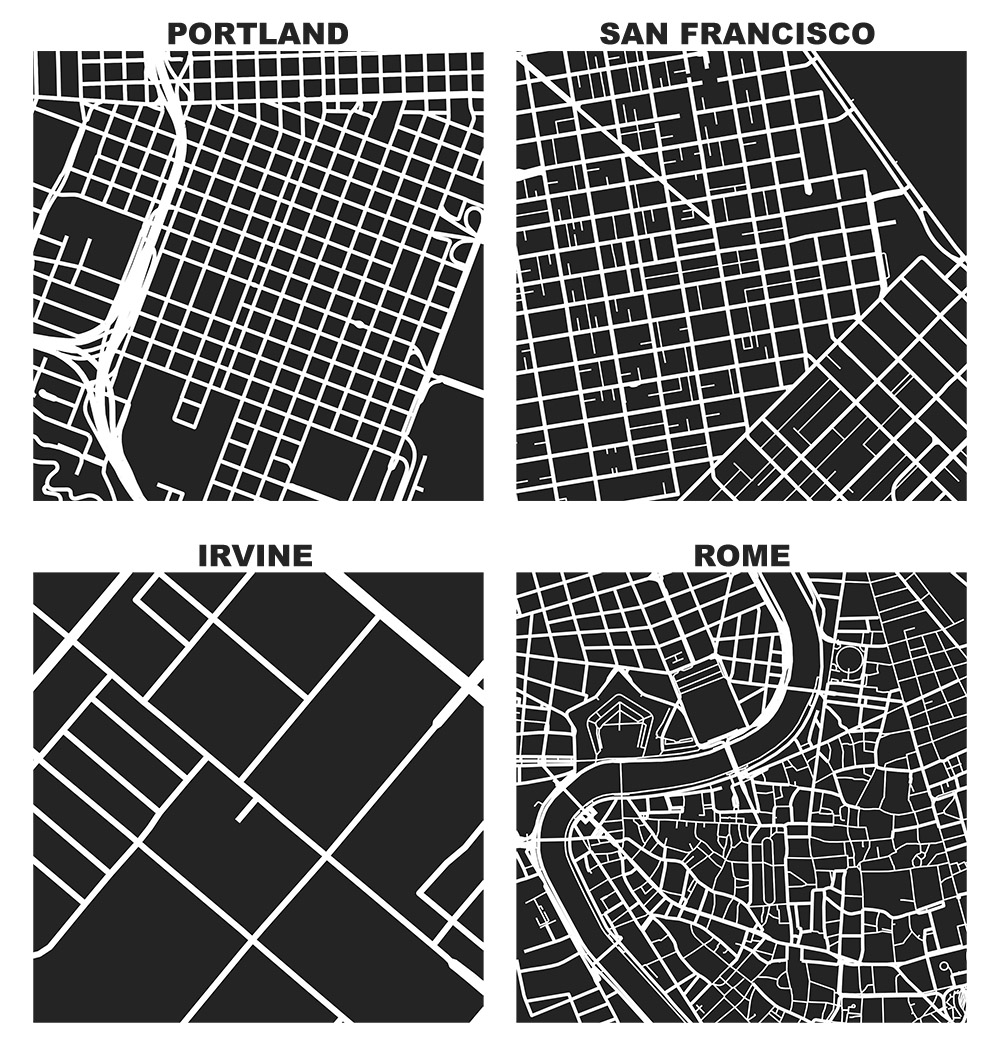
This presents a fantastic data source to help answer urban planning questions, but OpenStreetMap’s data has been somewhat difficult to work with due to its Byzantine query language and coarse-grained bulk extracts provided by third parties. As part of my dissertation, I developed a tool called OSMnx that allows researchers to download street networks and building footprints for any city name, address, or polygon in the world, then analyze and visualize them. OSMnx democratizes these data and methods to help technical and non-technical planners and researchers use OpenStreetMap data to study urban form, circulation networks, accessibility, and resilience.
Urban Form Figure-Ground Diagrams
Check out the journal article about OSMnx.
I previously demonstrated how to create figure-ground square-mile visualizations of urban street networks with OSMnx to consistently compare city patterns, design paradigms, and connectivity. OSMnx downloads, analyzes, and visualizes street networks from OpenStreetMap but it can also get building footprints. If we mash-up these building footprints with the street networks, we get a fascinating comparative window into urban form:
Square-Mile Street Network Visualization
Check out the journal article about OSMnx. All figures in this article come from this journal article, which you can read/cite for more.
The heart of Allan Jacobs’ classic book on street-level urban form and design, Great Streets, features dozens of hand-drawn figure-ground diagrams in the style of Nolli maps. Each depicts one square mile of a city’s street network. Drawing these cities at the same scale provides a revealing spatial objectivity in visually comparing their street networks and urban forms.
We can recreate these visualizations automatically with Python and the OSMnx package, which I developed as part of my dissertation. With OSMnx we can download a street network from OpenStreetMap for anywhere in the world in just one line of code. Here are the square-mile diagrams of Portland, San Francisco, Irvine, and Rome created and plotted automatically by OSMnx:
OSMnx: Python for Street Networks
If you use OSMnx in your work, please cite the journal article.
OSMnx is a Python package to retrieve, model, analyze, and visualize street networks from OpenStreetMap. Users can download and model walkable, drivable, or bikeable urban networks with a single line of Python code, and then easily analyze and visualize them. You can just as easily download and work with amenities/points of interest, building footprints, elevation data, street bearings/orientations, and network routing. If you use OSMnx in your work, please download/cite the paper here.
In a single line of code, OSMnx lets you download, model, and visualize the street network for, say, Modena Italy:
import osmnx as ox ox.plot_graph(ox.graph_from_place('Modena, Italy'))
Tools like WalkScore visualize how “walkable” a neighborhood is in terms of access to different amenities like parks, schools, or restaurants. It’s easy to create accessibility visualizations like these ad hoc with Python and its pandana library. Pandana (pandas for network analysis – developed by Fletcher Foti during his dissertation research here at UC Berkeley) performs fast accessibility queries over a network. I’ll demonstrate how to use it to visualize urban walkability. My code is in these IPython notebooks in this urban data science course GitHub repo.
First I give pandana a bounding box around Berkeley/Oakland in the East Bay of the San Francisco Bay Area. Then I load the street network and amenities from OpenStreetMap. In this example I’ll look at accessibility to restaurants, bars, and schools. But, you can create any basket of amenities that you are interested in – basically visualizing a personalized “AnythingScore” instead of a generic WalkScore for everyone. Finally I calculate and plot the distance from each node in the network to the nearest amenity:
Map Projections That Lie
How big is Greenland? It’s huge, right? At 836,109 square miles in size, Greenland is the largest island and the 12th largest country on Earth. With only 56,000 people living in that enormous area (80% of which is covered by the world’s only extant ice sheet outside of Antarctica), it is also the least densely populated country on Earth.
You can get a sense of how large Greenland is when you look at a map of the world:
It’s huge! Greenland is bigger than the entire continent of Africa! Or is it? The map above uses the common Mercator projection to project the 3-D surface of the Earth onto a 2-D surface suitable for a paper map or an image on your computer screen. But it’s not easy to project the curved surface of a sphere onto a rectangular plane. Compromises must be made. In the case of the Mercator projection, the compromise is that objects’ sizes become increasingly distorted the further they are from the equator. At the poles, the scale and distortion become infinite.
Off the Beaten Path in Myanmar
I recently had the opportunity to travel across Myanmar for the first time. It’s a fascinating country, only recently emerging from decades of isolation. Travelers here today are greeted with the first few baby steps toward a tourism industry, as well some of the kindest people and most spectacular sights in Asia.
Myanmar is not the easiest country to approach. It remains, effectively, a military dictatorship wracked with corruption and abuse. Government officials control the airlines and hotels for personal profit. Large swaths of eastern Myanmar are dedicated to opium plantations funneling foreign currency into the pockets of powerful officials. Even its name is controversial: many foreign governments still officially recognize only its traditional name, Burma, as a political statement against the authoritarian regime that renamed it Myanmar in 1989.