Categories
Tech

Scientific Python for Raspberry Pi

Raspberry Pi 3 Model BA guide to setting up the Python scientific stack, well-suited for geospatial analysis, on a Raspberry Pi 3. The whole process takes just a few minutes.

The Raspberry Pi 3 was announced two weeks ago and presents a substantial step up in computational power over its predecessors. It can serve as a functional Wi-Fi connected Linux desktop computer, albeit underpowered. However it’s perfectly capable of running the Python scientific computing stack including Jupyter, pandas, matplotlib, scipy, scikit-learn, and OSMnx.

Despite (or because of?) its low power, it’s ideal for low-overhead and repetitive tasks that researchers and engineers often face, including geocoding, web scraping, scheduled API calls, or recurring statistical or spatial analyses (with small-ish data sets). It’s also a great way to set up a simple server or experiment with Linux. This guide is aimed at newcomers to the world of Raspberry Pi and Linux, but who have an interest in setting up a Python environment on these $35 credit card sized computers. We’ll run through everything you need to do to get started (if your Pi is already up and running, skip steps 1 and 2).
Categories
Data

World Population Projections

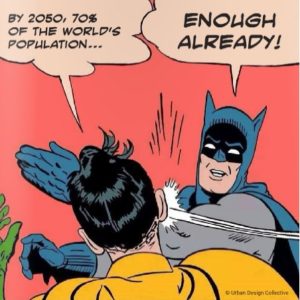
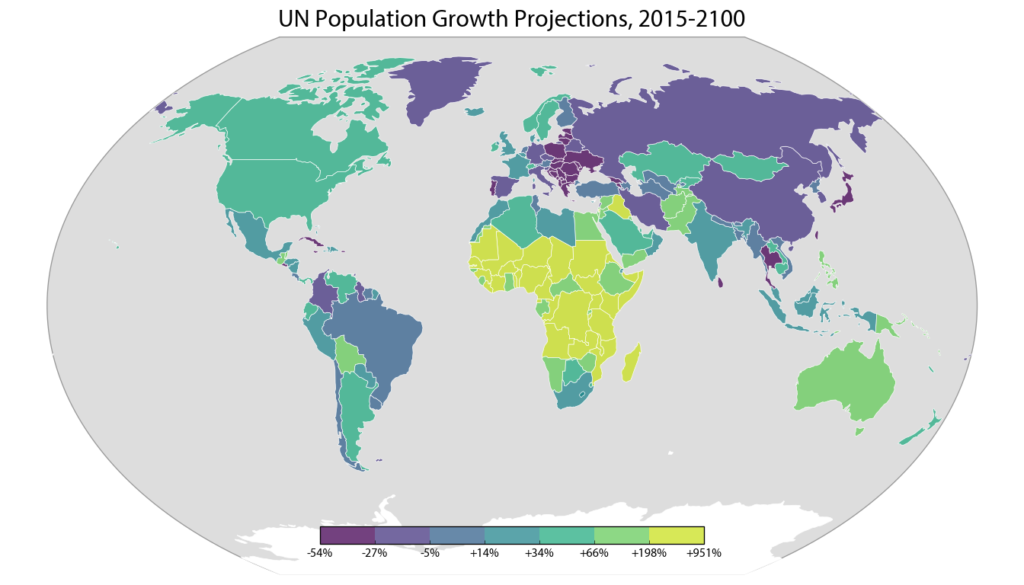
Batman and Robin: By 2050, 70% of the world's population...The U.N. world population prospects data set depicts the U.N.’s projections for every country’s population, decade by decade through 2100. The 2015 revision was recently released, and I analyzed, visualized, and mapped the data (methodology and code described below).

The world population is expected to grow from about 7.3 billion people today to 11.2 billion in 2100. While the populations of Eastern Europe, Taiwan, and Japan are projected to decline significantly over the 21st century, the U.N. projects Africa’s population to grow by an incredible 3.2 billion people. This map depicts each country’s projected percentage change in population from 2015 to 2100:

UN world population projections data map: Africa, Asia, Australia, Europe, North America, South America

Categories
Academia

Urban Informatics and Visualization at UC Berkeley

The fall semester begins next week at UC Berkeley. For the third year in a row, Paul Waddell and I will be teaching CP255: Urban Informatics and Visualization, and this is my first year as co-lead instructor.

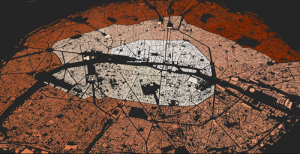
This masters-level course trains students to analyze urban data, develop indicators, conduct spatial analyses, create data visualizations, and build Paris open datainteractive web maps. To do this, we use the Python programming language, open source analysis and visualization tools, and public data.

This course is designed to provide future city planners with a toolkit of technical skills for quantitative problem solving. We don’t require any prior programming experience – we teach this from the ground up – but we do expect prior knowledge of basic statistics and GIS.

Update, September 2017: I am no longer a Berkeley GSI, but Paul’s class is ongoing. Check out his fantastic teaching materials in his GitHub repo. From my experiences here, I have developed a course series on urban data science with Python and Jupyter, available in this GitHub repo.