My article, Measuring the Complexity of Urban Form and Design, is now in-press for publication at Urban Design International (download free PDF). Cities are complex systems composed of many human agents interacting in physical urban space. This paper develops a typology of measures and indicators for assessing the physical complexity of the built environment at the scale of urban design. It extends quantitative measures from city planning, network science, ecosystems studies, fractal geometry, statistical physics, and information theory to the analysis of urban form and qualitative human experience.
Tag: chaos
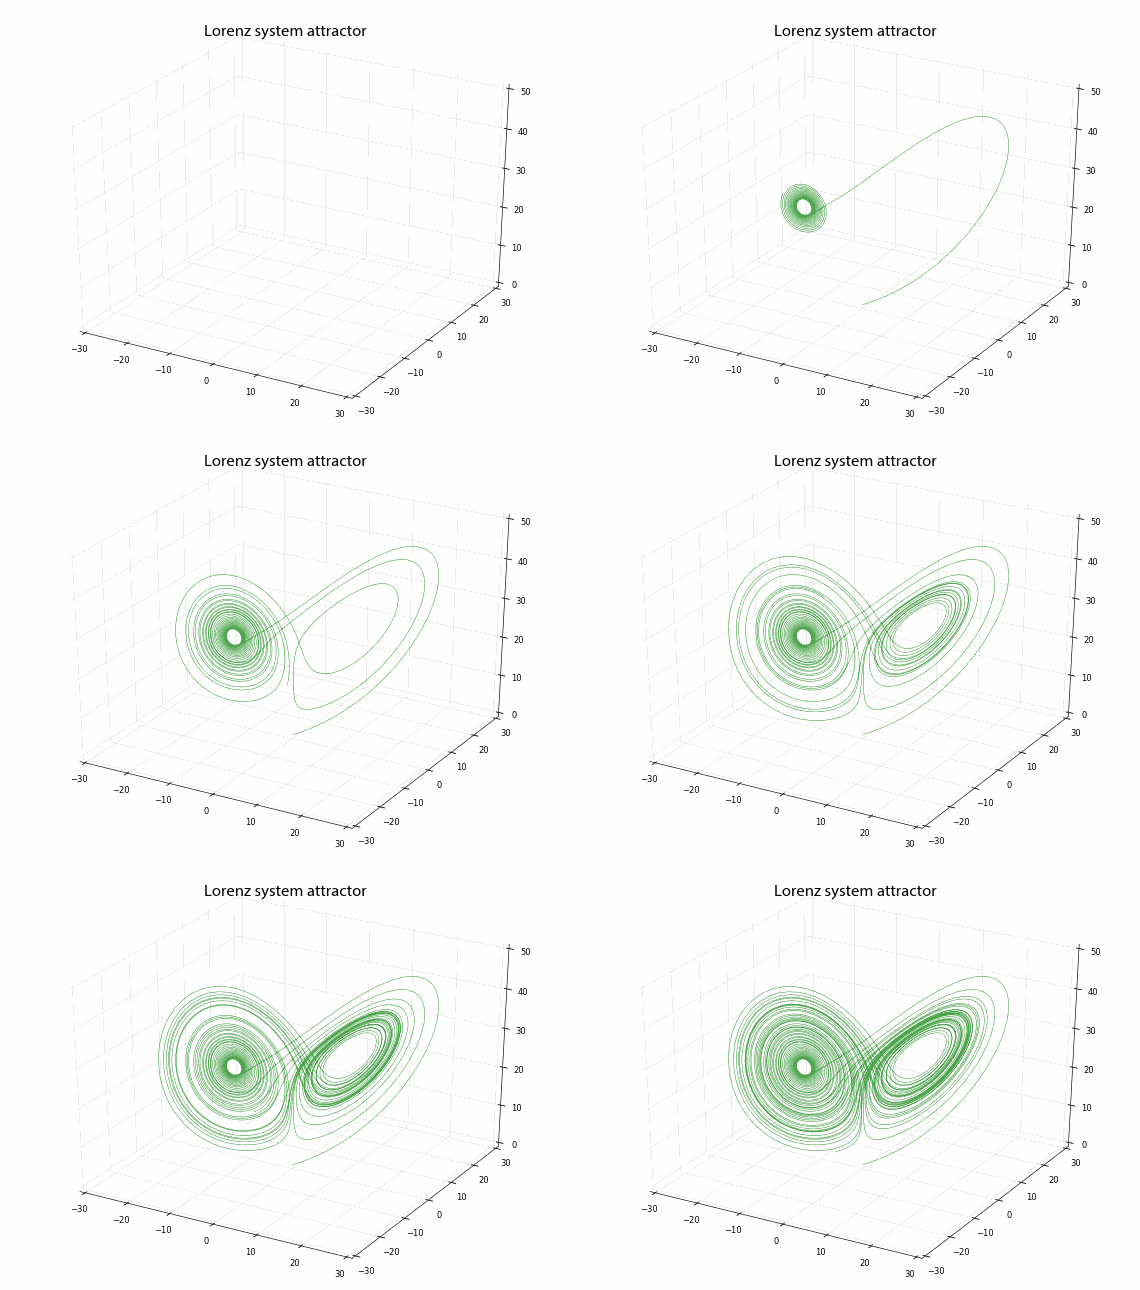
Animating the Lorenz Attractor with Python
Edward Lorenz, the father of chaos theory, once described chaos as “when the present determines the future, but the approximate present does not approximately determine the future.”
Lorenz first discovered chaos by accident while developing a simple mathematical model of atmospheric convection, using three ordinary differential equations. He found that nearly indistinguishable initial conditions could produce completely divergent outcomes, rendering weather prediction impossible beyond a time horizon of about a fortnight.
Animated 3-D Plots in Python
In a previous post, I discussed chaos, fractals, and strange attractors. I also showed how to visualize them with static 3-D plots. Here, I’ll demonstrate how to create these animated visualizations using Python and matplotlib. All of my source code is available in this GitHub repo. By the end, we’ll produce animated data visualizations like this, in pure Python:
Visualizing Chaos and Randomness
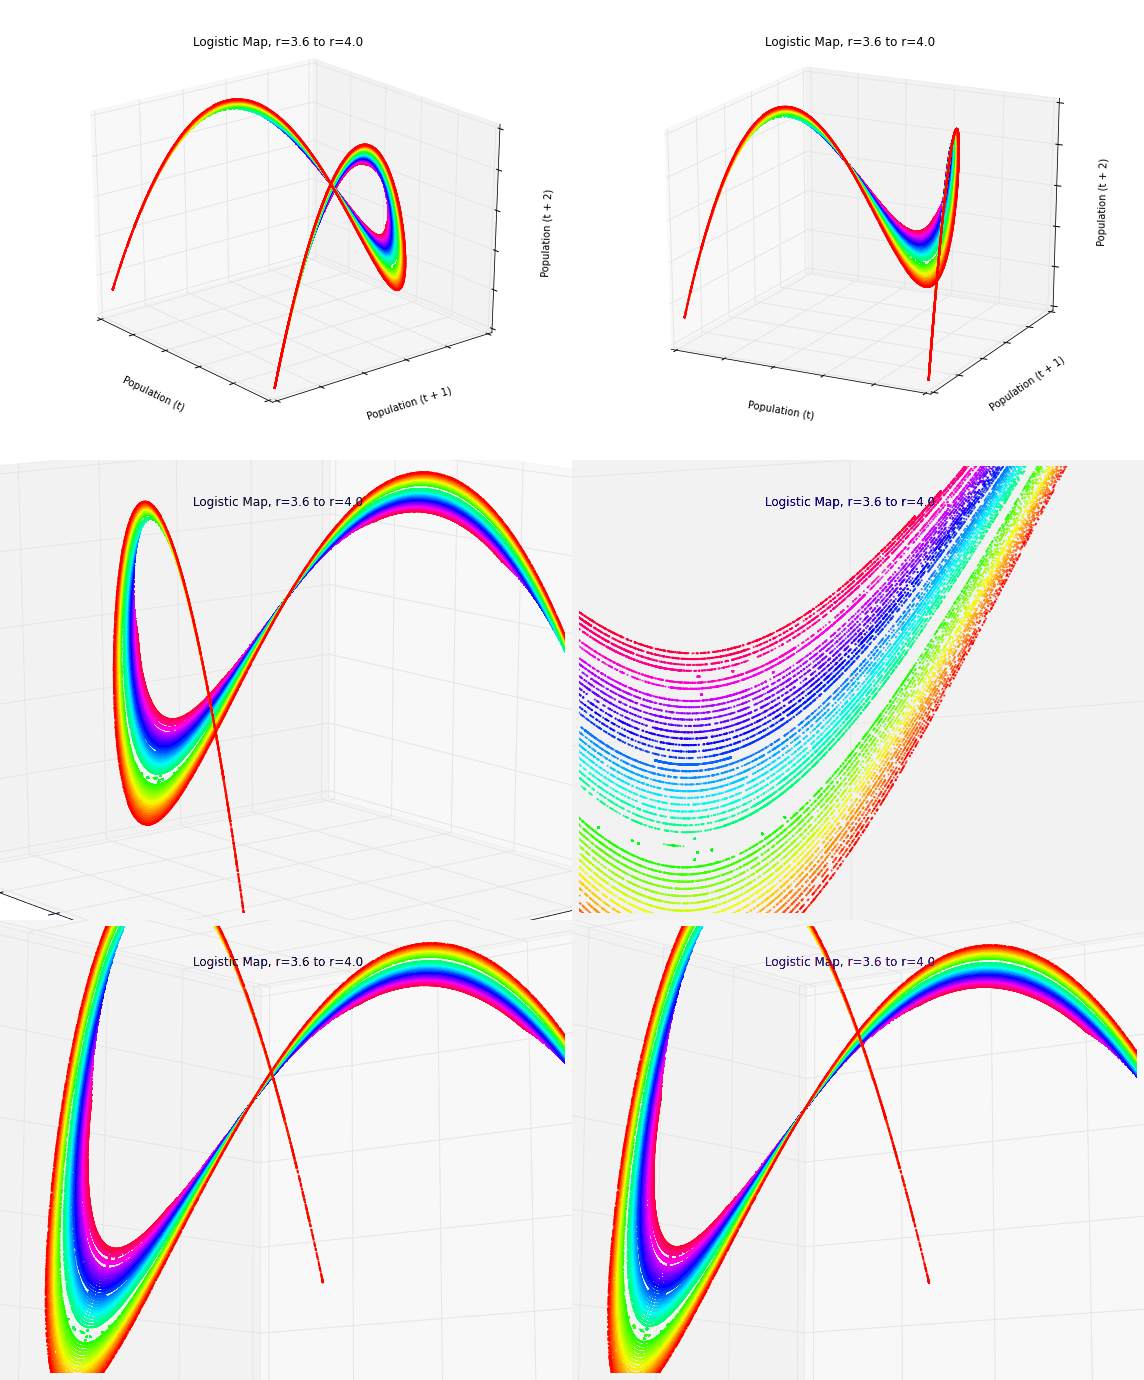
In a previous post, I discussed chaos theory, fractals, and strange attractors – and their implications for knowledge and prediction of systems. I also briefly touched on how phase diagrams (or Poincaré plots) can help us visualize system attractors and differentiate chaotic behavior from true randomness.
In this post (adapted from this paper), I provide more detail on constructing and interpreting phase diagrams. These methods are particularly useful for discovering deterministic chaos in otherwise random-appearing time series data, as they visualize strange attractors. I’m using Python for all of these visualizations and the source code is available in this GitHub repo.
Chaos Theory and the Logistic Map
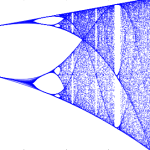
 Using Python to visualize chaos, fractals, and self-similarity to better understand the limits of knowledge and prediction. Download/cite the article here and try pynamical yourself.
Chaos theory is a branch of mathematics that deals with nonlinear dynamical systems. A system is just a set of interacting components that form a larger whole. Nonlinear means that due to feedback or multiplicative effects between the components, the whole becomes something greater than just adding up the individual parts. Lastly, dynamical means the system changes over time based on its current state. In the following piece (adapted from this article), I break down some of this jargon, visualize interesting characteristics of chaos, and discuss its implications for knowledge and prediction.
Chaotic systems are a simple sub-type of nonlinear dynamical systems. They may contain very few interacting parts and these may follow very simple rules, but these systems all have a very sensitive dependence on their initial conditions. Despite their deterministic simplicity, over time these systems can produce totally unpredictable and wildly divergent (aka, chaotic) behavior. Edward Lorenz, the father of chaos theory, described chaos as “when the present determines the future, but the approximate present does not approximately determine the future.”


