Resilient by Design
I have a new article out now in Transportation Research Part A: Policy and Practice. Here’s a free open-access pre-print if you lack institutional access.
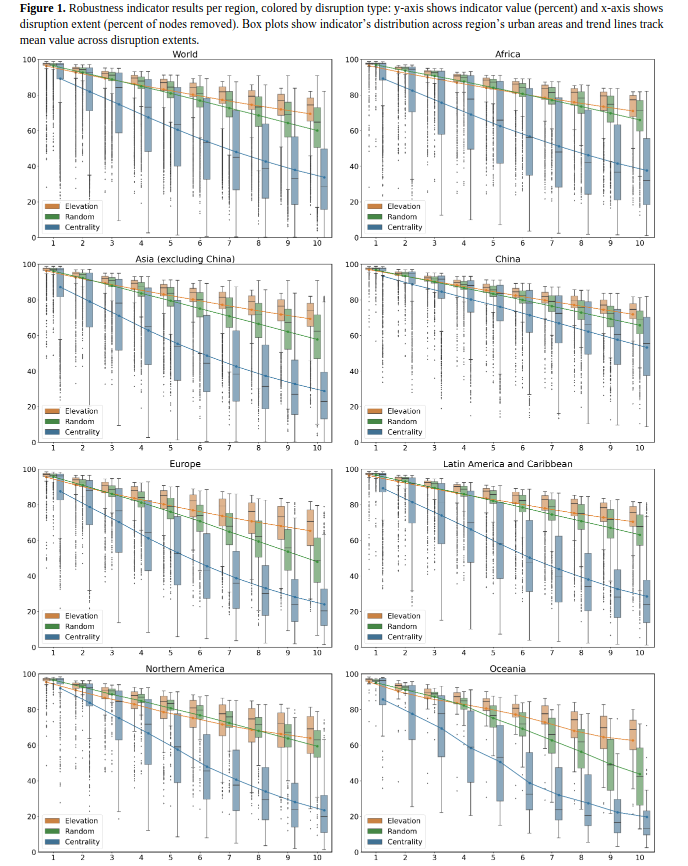
We simulate over 2.4 billion trips across every urban area in the world to measure street network vulnerability to disasters, then measure the relationships between street network design and these vulnerability indicators.
First we modeled the street networks of more than 8,000 urban areas in 178 countries. Then, for each urban area, we simulated disasters of 3 different types (representing floods, earthquakes, and targeted attacks) and 10 different extents. Then we simulated over 2.4 billion trips on these networks to measure how certain trips become more circuitous or even impossible to complete as parts of the network fail after a disaster. Finally we built a model to predict how much a disaster would impact trips.
This model reveals how certain street network designs allow people and goods to continue to flow after a disaster. All else equal, networks with higher connectivity, fewer chokepoints, and less circuity are less vulnerable to disruption.

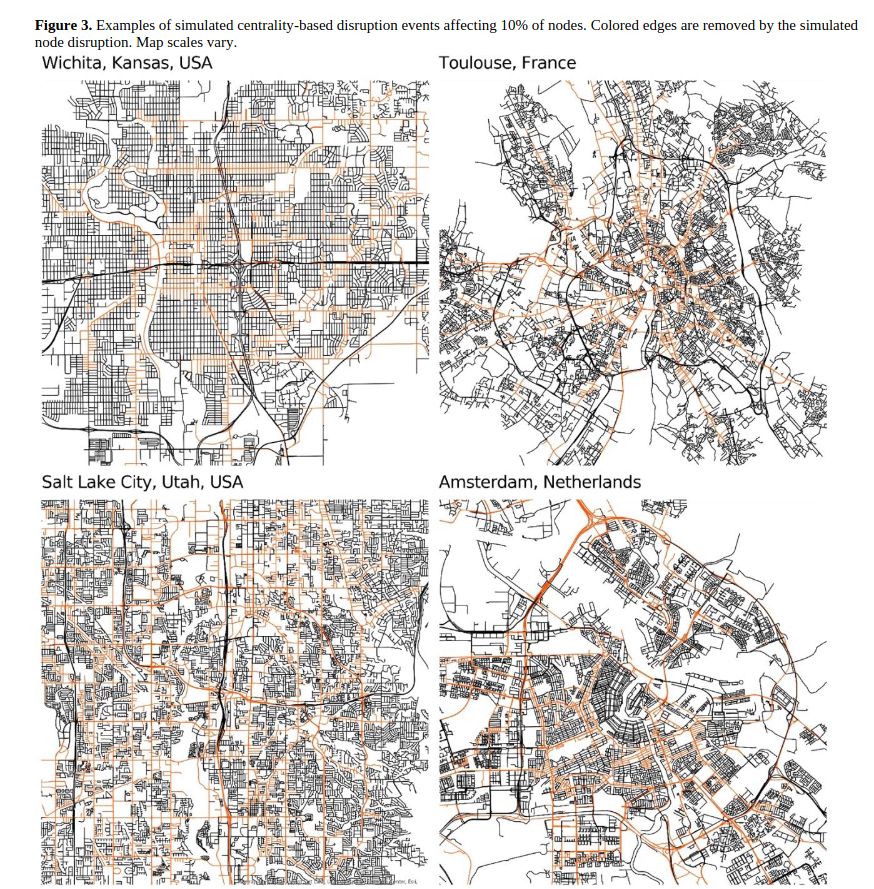
In other words, a sprawling dendritic street network is easy to disconnect by knocking out a few key nodes that link neighborhoods together. But (for example) even the otherwise dense, connected Amsterdam is easy to disconnect by targeting its chokepoints (like canal bridges).

These design characteristics offer high leverage points for street network resilience and robustness that planners should emphasize when designing or retrofitting urban networks. They shape how reliable our infrastructure networks remain when we most urgently need them.
For more, check out our paper at TR-A