A few months ago, I wrote about the large investments that U.S. universities are making in their football stadiums. This also included a visual analysis of stadium capacity around the country. Outside of North Korea, the 8 largest stadiums in the world are college football stadiums, and the 15 largest college football stadiums are larger than any NFL stadium.
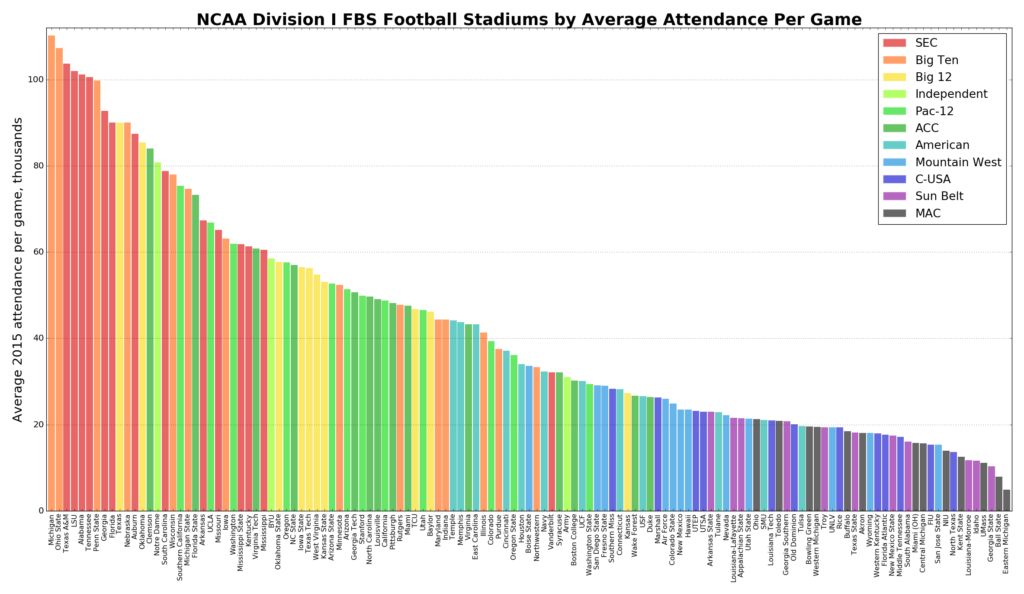
I received a few comments interested in further analysis of the actual attendance of games held in these stadiums. While capacity is interesting because it represents an expectation and sustained investment by the school, attendance represents the utilization of that investment. My stadium capacity data covered every NCAA division I football stadium in the U.S. as of the 2015 college football season. So, I downloaded the NCAA’s 2015 home game attendance data to compare. My data, code, and analysis are in this GitHub repo. First, I visualized the FBS attendance figures themselves:
