Craigslist and U.S. Rental Housing Markets
This is a summary of our JPER journal article (available here) about Craigslist rental listings’ insights into U.S. housing markets.
Rentals make up a significant portion of the U.S. housing market, but much of this market activity is poorly understood due to its informal characteristics and historically minimal data trail. The UC Berkeley Urban Analytics Lab collected, validated, and analyzed 11 million Craigslist rental listings to discover fine-grained patterns across metropolitan housing markets in the United States. I’ll summarize our findings below and explain the methodology at the bottom.
But first, 4 key takeaways:
- There are incredibly few rental units below fair market rent in the hottest housing markets. Some metro areas like New York and Boston have only single-digit percentages of Craigslist rental listings below fair market rent. That’s really low.
- This problem doesn’t exclusively affect the poor: the share of its income that the typical household would spend on the typical rent in cities like New York and San Francisco exceeds the threshold for “rent burden.”
- Rents are more “compressed” in soft markets. For example, in Detroit, most of the listed units are concentrated within a very narrow band of rent/ft² values, but in San Francisco rents are much more dispersed. Housing vouchers may end up working very differently in high-cost vs low-cost areas.
- Craigslist listings correspond reasonably well with Dept of Housing and Urban Development (HUD) estimates, but provide up-to-date data including unit characteristics, from neighborhood to national scales. For example, we can see how rents are changing, neighborhood by neighborhood, in San Francisco in a given month.
Housing trends on Craigslist
I’ll run through the findings and explain the methodology at the end. The data set contains 11 million Craigslist rental listings from summer 2014. Nationwide, the median rent is $1,145, the median square footage is 982, the median rent/ft² is $1.11, and the average number of bedrooms is 2. This map depicts 1.5 million geolocated Craigslist rental listings in the contiguous U.S.:
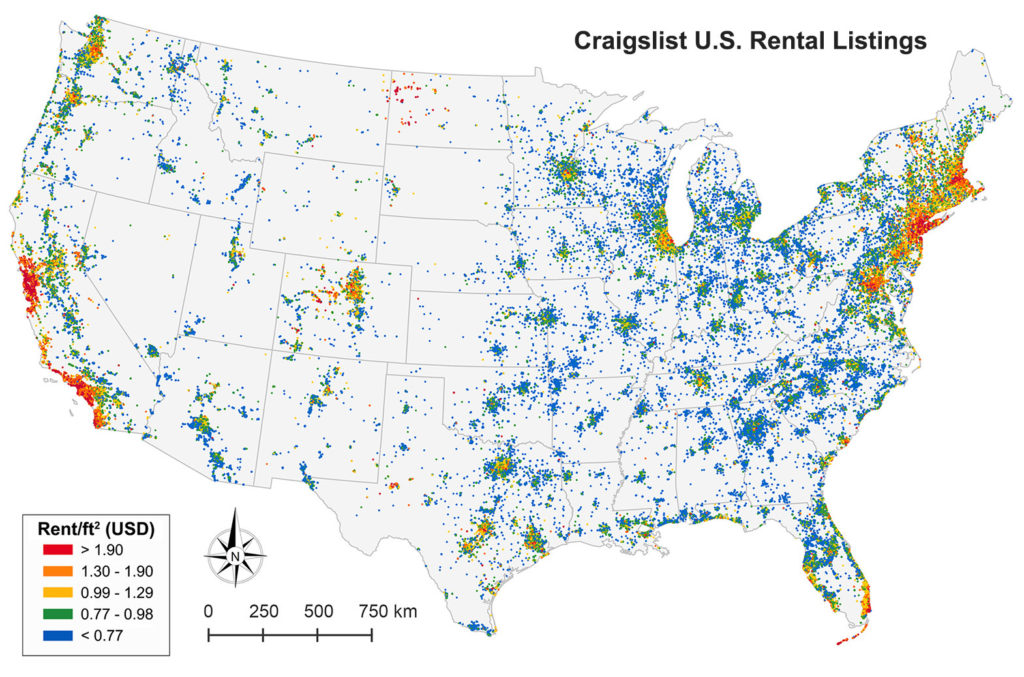
Craigslist conforms to our geographic expectations of the U.S. housing market: large cities on both coasts have high rents, particularly through the Boston- Washington corridor and along the coast of California. Other hot-spots exist in south Florida and the metro areas of large, affluent cities like Chicago, Denver, and Seattle.
The interior of the U.S. has a sprinkling of less-expensive listings punctuated by mid-priced clusters around major cities and regional centers. Interestingly, rental listings in North Dakota generally have extremely high rents/ft², reflecting unmet demand for housing in oil-producing areas. In fact, North Dakota has the 2nd-highest median rent/ft² of any Craigslist region:
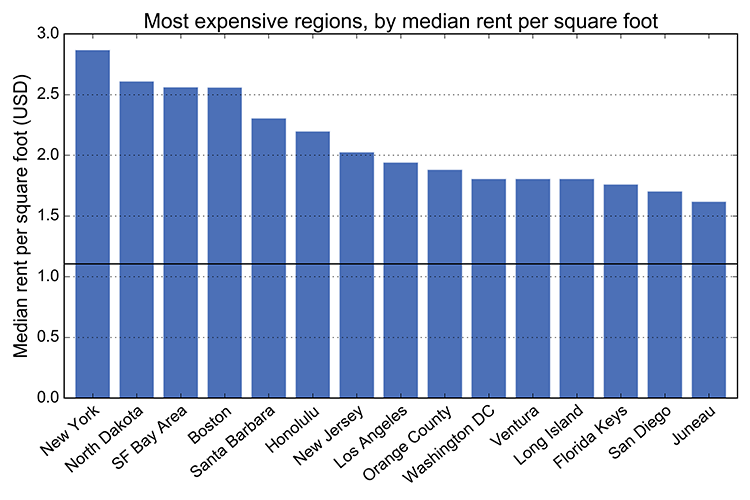
By region I just mean Craigslist subdomain, like “Boston” in
https://boston.craigslist.org. Overall, New York, North Dakota, San Francisco,
Boston, and Santa Barbara are the most expensive Craigslist regions. The other
usual suspects from Southern California, Hawaii, and the Eastern Seaboard also
pepper this list. But among the 15 most populous metro areas, the large cities
elsewhere in the Sunbelt (plus Detroit) are much cheaper:
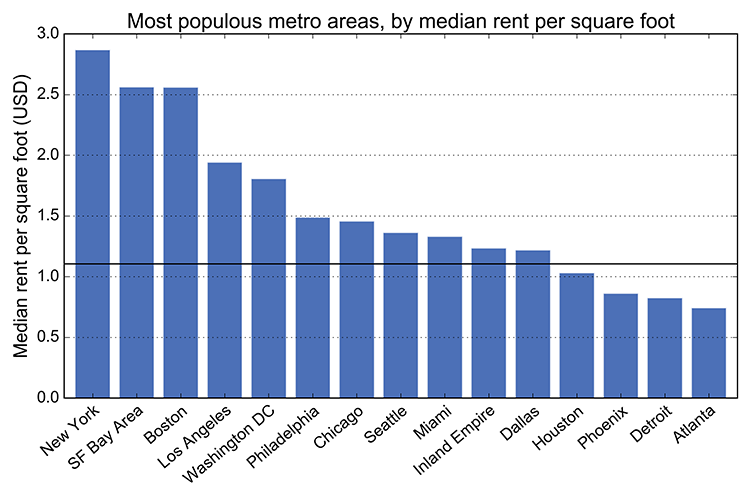
New York’s median rent/ft² is more than 3.5x higher than Atlanta’s, reflecting underlying differences in land values which capitalize variation in amenities, incomes, supply, and demand. Median rent figures for all cities appear in the article so I won’t belabor them here, but suffice it to say that the median rental unit in metro areas like New York, Boston, and the Bay Area costs well over $2,300/mo. That’s across the whole metro area and its exurbs - not just the typical pricey urban core.
Rents also vary widely within cities. To examine this, we estimated the distribution of rents/ft² for each of the 415 Craigslist regions in the U.S.:
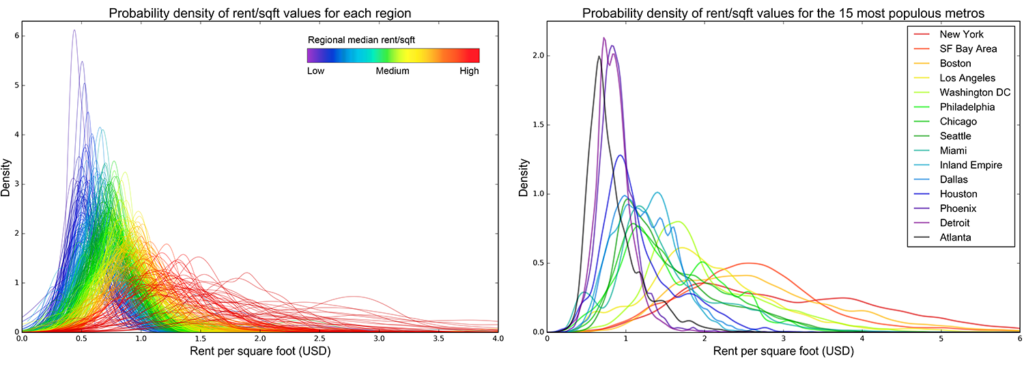
I know that this rainbow spaghetti is a bit much, but bear with me for a moment. The color gradient just shows that metros with lower median rents/ft² tend to peak at lower values and tend to be more peaked. This “compression” of rents in soft markets is significant. In Detroit, most of the listed units are concentrated within a very narrow band of rent/ft² values, but in San Francisco rents are much, much more dispersed.
Metropolitan fair market rent based housing vouchers—designed to unlock neighborhoods of opportunity to the poor—may work differently in high-cost versus low-cost areas. Wide variations in rents within a city might make it very difficult for voucher holders to “move the needle” and upgrade neighborhoods in a statistically dispersed market like San Francisco’s, especially when considering household size.
Housing affordability on Craigslist
The article looks at three simple but telling indicators of affordability: the proportion of income spent on rent, the proportion of listings below fair market rent, and a “rental power” indicator. I’ll summarize each briefly:
a.) Rent burden
The standard definition of “rent burden” is rent exceeding 30% of household income. This chart shows the share of its income that a typical (i.e., median) household would spend on a typical Craigslist rent, in each of the 15 most populous metro areas:
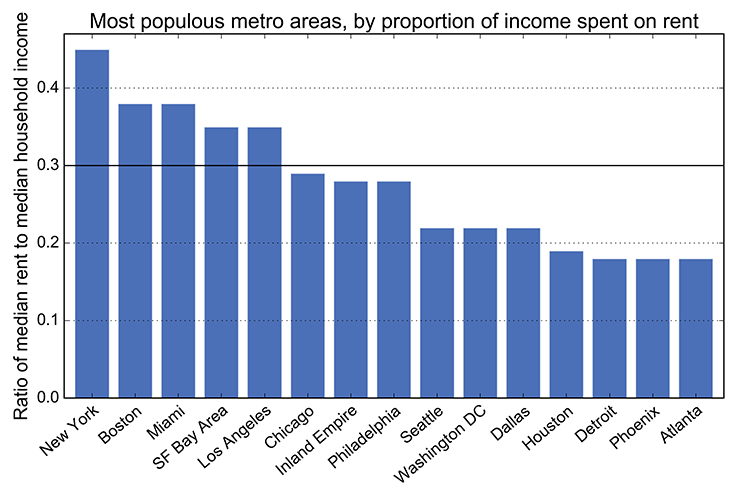
At their median rent and income values, New York, Los Angeles, San Francisco, Miami, Boston, and San Diego all exceed the rent burden threshold. In other words, the typical household renting the typical apartment on Craigslist would experience (what’s supposed to be) atypical rent burden. Details for all the other metro areas are available in the journal article.
b.) Fair market rent
HUD generally defines fair market rent as the region’s 40th percentile rent. 37% of the Craigslist listings are below the corresponding HUD fair market rent – quite close to the expected value of 40%. However there is considerable variation. More than two-thirds of the listings in Phoenix and Las Vegas are below the fair market rent, but New York and Boston have only single-digit percentages of listings below this threshold:
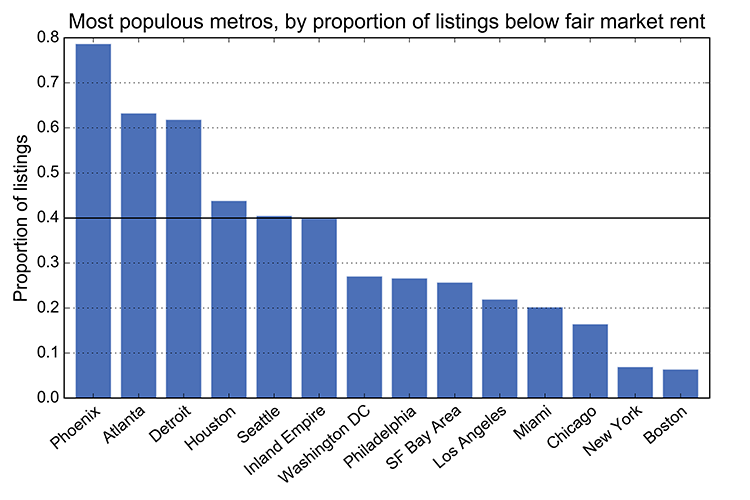
This is troubling for housing advocates. As discussed earlier, fair market rents might be insufficient for households trying to upgrade neighborhoods in metros with highly dispersed rents; they also appear to limit housing seekers in New York and Boston (among others) to very narrow slices of available housing units.
Furthermore, the HUD fair market rent for a 2-bedroom unit in Alameda County (in the San Francisco Bay Area) dropped from $1,585 in 2015 to $1,580 in 2016 (despite the region’s skyrocketing rents) because HUD extrapolated it from the 2013 5-year rolling-average ACS estimate. Craigslist data offer a real-time alternative to easily take the pulse of local housing rental markets at fine scales to inform current estimates.
c.) Rental power
Finally, the “rental power” indicator represents an estimate of how many square feet someone can rent on Craigslist in each metro area for the nationwide median rent of $1,145. It simply divides the nationwide median rent by each regional median rent/ft²:
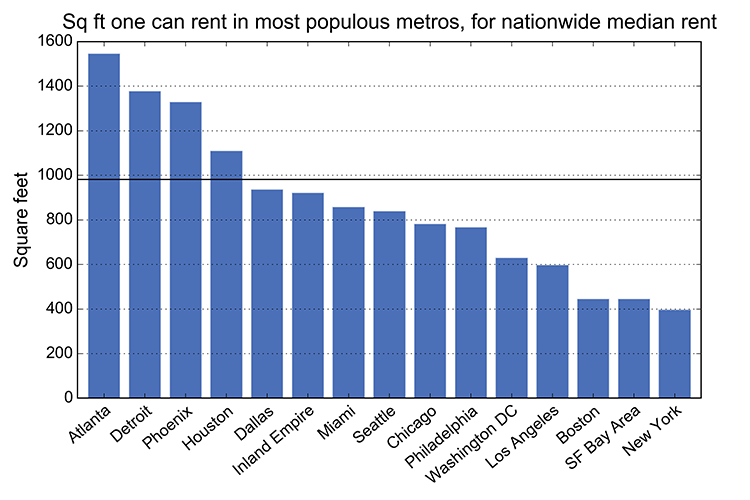
Memphis, TN offers the greatest value among large metros at 1,659 square feet, while New York offers the least value at 398 square feet. Details for all the other metro areas are in the journal article.
Metropolitan patterns
Urban planners need current data at the local scale. We calculated census tract-level median rents/ft² from 100,000 San Francisco Bay Area listings and mapped the results. Such visualizations enable local planners to quickly take the pulse of changing neighborhoods:
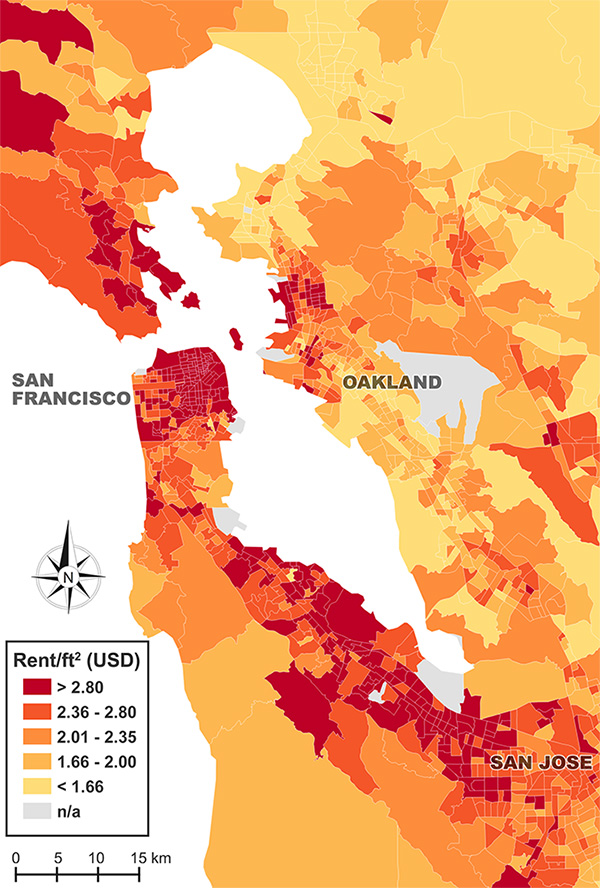
San Francisco, Berkeley, and Silicon Valley are very expensive, while East Oakland and Vallejo are less so. This is a powerful tool for understanding housing characteristics, trends, and affordability: we can see how rents are changing, neighborhood by neighborhood, in San Francisco in a given month.
In southern California, the greater Los Angeles area similarly shows a gradient in rents from expensive coastal areas towards cheaper inland areas. Although some inland urban areas like San Bernardino and Palm Springs have moderate rents, others like Victorville are heavily represented by the lowest quintiles:
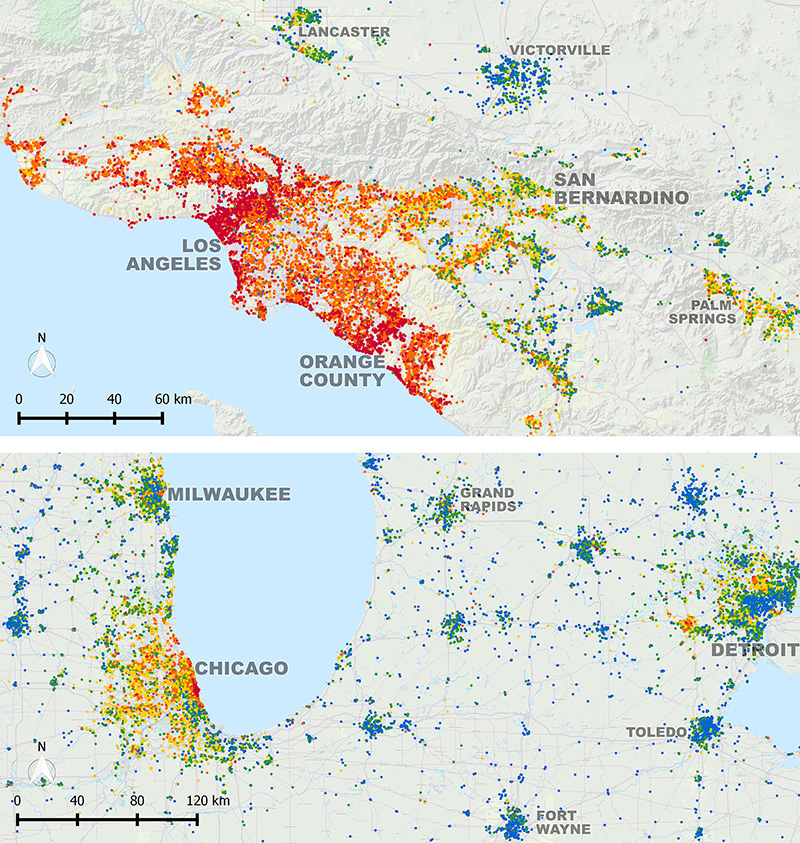
The Craigslist data reveal different spatial patterns elsewhere in the country. In the Midwest, Chicago has a high-priced urban core with mid-priced suburbs, but Detroit inverts this metropolitan model with a low-priced core and more expensive exurbs. This is consistent with Detroit’s history of capital flight and white flight over the past 50 years. Likewise, small “rust belt” cities in Indiana, Ohio, and Michigan are dominated by listings in the lowest quintiles.
Usage trends
On Craigslist, the most rental listing activity takes place on Mondays and Tuesdays, while Sundays have the fewest listings posted. From Monday onward, the number of daily listings posted declines, before repeating all over again the next week. Median rents/ft² are about 11.5% higher on Sundays (the most expensive day) than they are on Mondays (the least expensive day). Housing advocates might target housing searches to take advantage of rhythms in volume, cost, and unit characteristics.
Methodology and validation
This project was conducted in Paul Waddell’s Urban Analytics Lab, which collected 11 million rental listings from Craigslist across the U.S. between May and July 2014 using a web scraper built with Python. For a full discussion of the web scraping methodology and copyright law, check out the journal article. This study cleaned the data, extracted useful elements, organized them, and analyzed them, all with Python and its pandas, numpy, and matplotlib libraries.
The study validated the listings data against HUD’s median rents for this time period by calculating correlation coefficients to assess co-variation for a sample of metros. The correlations between the Craigslist and HUD median rents are positive, strong, and statistically significant:
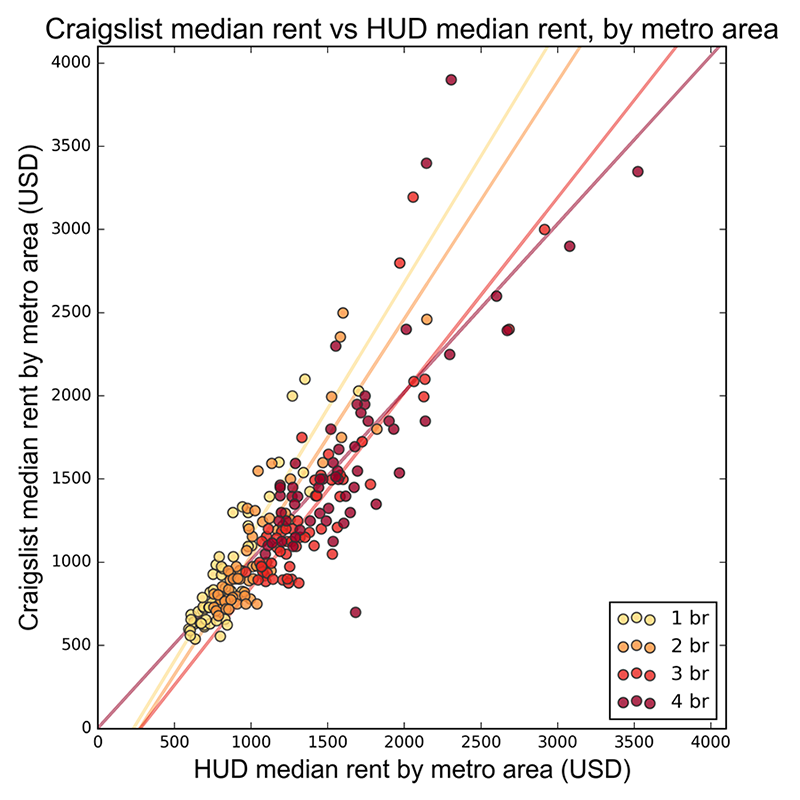
On average, median rents are 7% higher for 1-bedroom, 3% higher for 2-bedroom, 7% lower for 3 bedroom, and 1% higher for 4-bedroom units than the corresponding HUD median rents. However, the bias varies between regions: New Orleans and Oklahoma City have very similar median rents across the two data sets, while other regions like Las Vegas have considerably lower median rents in the Craigslist data set, while yet other regions like New York have considerably higher median rents in the Craigslist data set.
Conclusion
Long story short: there are incredibly few rental units below fair market rent in the hottest housing markets. This (along with the compression of rents) tells us there might be a big disconnect between housing vouchers and the largest rental housing information exchange (Craigslist). This problem doesn’t exclusively affect the poor: the median household in cities like New York and San Francisco would experience rent burden when paying the median rent.
These national, regional, and local patterns conform to general expectations, yet offer far fresher and finer-grained data. However, Craigslist listings provide advertised rents, not final negotiated rents in legal contracts, and some rental markets like New York’s are dominated by brokers. Craigslist is not representative of the entire housing market: individuals vary in levels of Internet access and technical savvy to list and search for housing online as a function of wealth, employment, education, language, and other socio- demographic traits. Nevertheless, Craigslist presents an invaluable data source for housing research.
Citation info : Boeing, G. and P. Waddell. 2016. “New Insights into Rental Housing Markets across the United States: Web Scraping and Analyzing Craigslist Rental Listings.” Journal of Planning Education and Research. Online first. DOI: 10.1177/0739456X16664789