Categories
Academia

Urban Informatics and Visualization at UC Berkeley

The fall semester begins next week at UC Berkeley. For the third year in a row, Paul Waddell and I will be teaching CP255: Urban Informatics and Visualization, and this is my first year as co-lead instructor.

This masters-level course trains students to analyze urban data, develop indicators, conduct spatial analyses, create data visualizations, and build Paris open datainteractive web maps. To do this, we use the Python programming language, open source analysis and visualization tools, and public data.
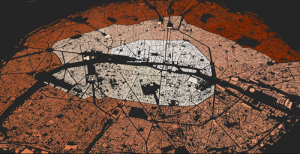
This course is designed to provide future city planners with a toolkit of technical skills for quantitative problem solving. We don’t require any prior programming experience – we teach this from the ground up – but we do expect prior knowledge of basic statistics and GIS.

Update, September 2017: I am no longer a Berkeley GSI, but Paul’s class is ongoing. Check out his fantastic teaching materials in his GitHub repo. From my experiences here, I have developed a course series on urban data science with Python and Jupyter, available in this GitHub repo.

Categories
Travel

Oregon Night Skies

I drove through Oregon last week and took some night sky photos. These first two are from Indian Mary park in southern Oregon, along the banks of the Rogue River:

Milky Way in the night sky, viewed from Indian Mary park in southern Oregon

Categories
Data

Map Projections That Lie

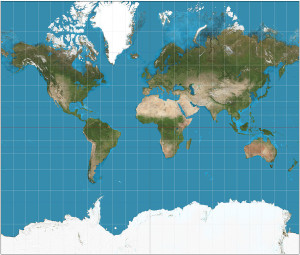
How big is Greenland? It’s huge, right? At 836,109 square miles in size, Greenland is the largest island and the 12th largest country on Earth. With only 56,000 people living in that enormous area (80% of which is covered by the world’s only extant ice sheet outside of Antarctica), it is also the least densely populated country on Earth.

You can get a sense of how large Greenland is when you look at a map of the world:

world map mercator projection

It’s huge! Greenland is bigger than the entire continent of Africa! Or is it? The map above uses the common Mercator projection to project the 3-D surface of the Earth onto a 2-D surface suitable for a paper map or an image on your computer screen. But it’s not easy to project the curved surface of a sphere onto a rectangular plane. Compromises must be made. In the case of the Mercator projection, the compromise is that objects’ sizes become increasingly distorted the further they are from the equator. At the poles, the scale and distortion become infinite.