This post is part of a series on visualizing data from my summer travels.
I’ve previously discussed my goals in visualizing GPS data from my summer travels and explored visualizing the data set with CartoDB and with Leaflet. The full OpenPaths location data from my summer travels is available here and I discussed how I reverse-geocoded it here.
Mapbox is a major provider of online web mapping services such as tiled web maps, the Tilemill cartography IDE, and the mapbox.js javascript library. Today I’ll run through how to create an interactive data map in Tilemill’s design studio, export the map as a set of tiles, upload the tileset to Mapbox, and then use a javascript client to display the map on a web page. Our final result will look something like this:
Creating map tiles with Tilemill
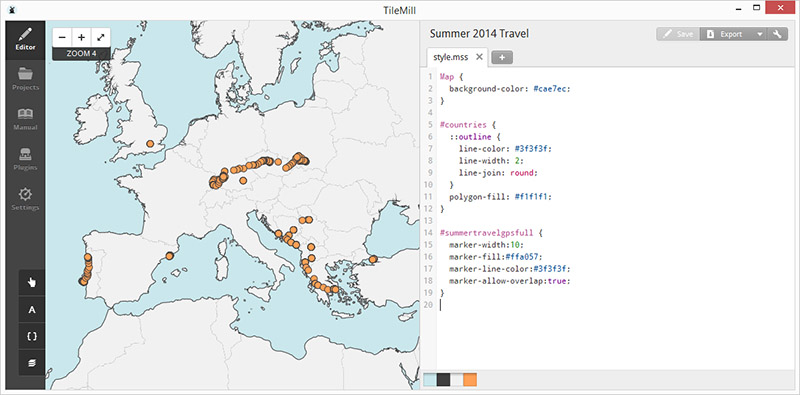
First, download and install the Tilemill IDE and create a new Mapbox account. Open Tilemill, choose “new project,” and provide it a filename, name, and description. Click the layers icon in the bottom-left, choose “new layer,” and browse to the CSV data set. Choose save and style, then you should see the point data displayed on the map. I styled mine like this:
Map {
  background-color: #cae7ec;
}
#countries {
  ::outline {
    line-color: #3f3f3f;
    line-width: 2;
    line-join: round;
  }
  polygon-fill: #f1f1f1;
}
#summertravelgpsfull {
  marker-width:10;
  marker-fill:#ffa057;
  marker-line-color:#3f3f3f;
  marker-allow-overlap:true;
}
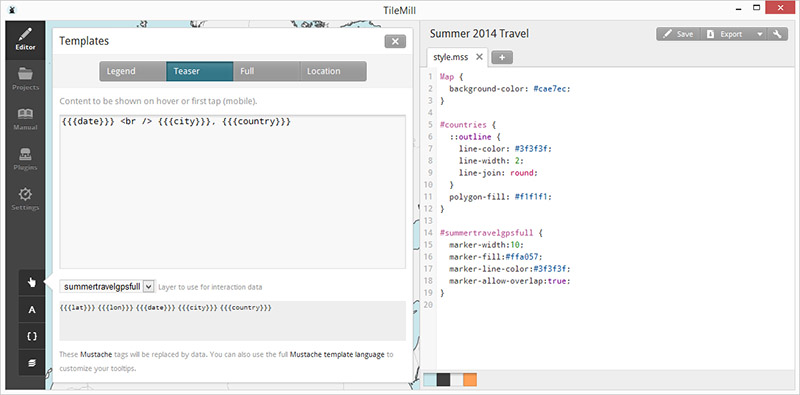
Click the templates button in the bottom-left. Here you can enter text and data fields to display as a pop up:
Export to Mapbox
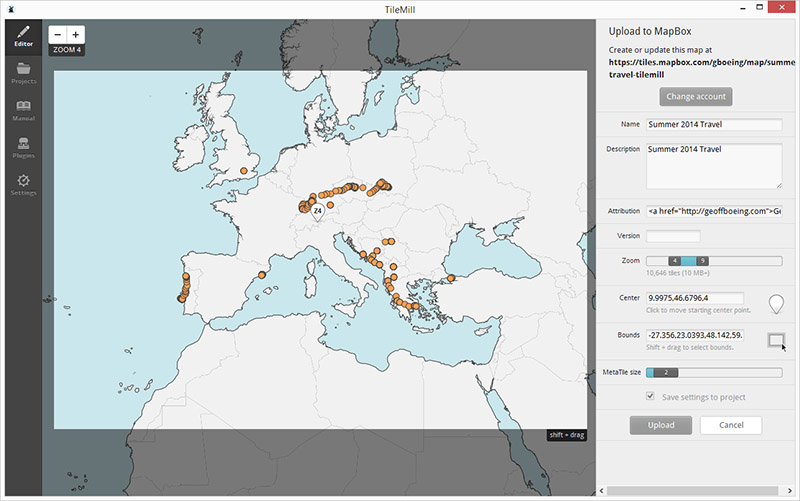
Ok. We’ve got a simple basemap layer, a layer of styled GPS point data, and pop up information when we hover over or click on a data point. It’s time to export our tiles and upload them to Mapbox for turning them into a web map. Click Export > Upload on the top-right. Choose a center and bounds for your map and specify zoom levels. Your choices here must balance map detail and extent vs the file size of your tile set. Here’s how I configured it:
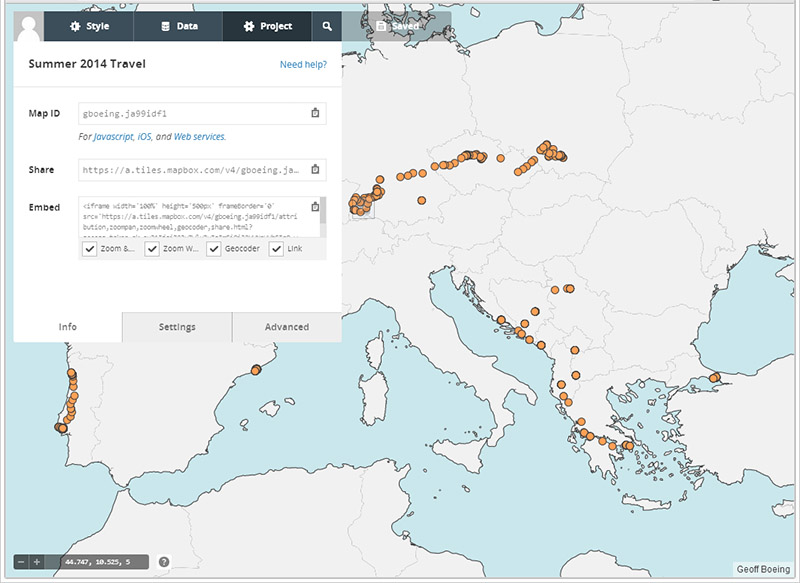
Mine weighs in at 13.1 MB. When you’re done configuring, click the upload button. It will take a couple of minutes to process the data and upload it all to Mapbox’s servers. When it’s done, go to data on the Mapbox web site, click your newly uploaded data set, and choose “create project.” In your project, the info tab provides embed code to stick this map on a web page, but let’s create a new javascript map instead. Copy the map ID from the info box.
Using your tiles in a web map
On your computer, create a new HTML file from the code below. This code loads the Mapbox.js javascript library and its CSS file from Mapbox’s servers. Then it creates a div to contain our map. Lastly, there are two lines of javascript. The first defines your access token, which you can get from your Mapbox account page. The second specifies the div ID and the map ID we copied from the info box in the previous step:
<!DOCTYPE html>
<html>
<head>
	<title>Summer Travel GPS Data Visualization with Mapbox</title>
	<meta charset='utf-8' />
	<script src='https://api.tiles.mapbox.com/mapbox.js/v2.0.1/mapbox.js'></script>
	<link href='https://api.tiles.mapbox.com/mapbox.js/v2.0.1/mapbox.css' rel='stylesheet' />
</head>
<body>

<div id='summer-travel-mapbox-map' style='width: 600px; height: 400px'></div>

	<script>
	L.mapbox.accessToken = 'YOUR-TOKEN-HERE';
	L.mapbox.map('summer-travel-mapbox-map', 'YOUR-MAP-ID-HERE');
	</script>
</body>
</html>
All done! Save your HTML file, then open it in a web browser. The Mapbox map will appear like the one at the top of this page. It’s zoomable and clickable – each data point has a popup with time, date, city, and country information. You can compare this visualization to similar ones using CartoDB or Leaflet.


One reply on “Visualizing Summer Travels Part 4: Mapbox + Tilemill”
[…] and MapBox: more advanced web mapping for community engagement, advocacy, and visualizing research […]