A few months ago, I wrote about the large investments that U.S. universities are making in their football stadiums. This also included a visual analysis of stadium capacity around the country. Outside of North Korea, the 8 largest stadiums in the world are college football stadiums, and the 15 largest college football stadiums are larger than any NFL stadium.
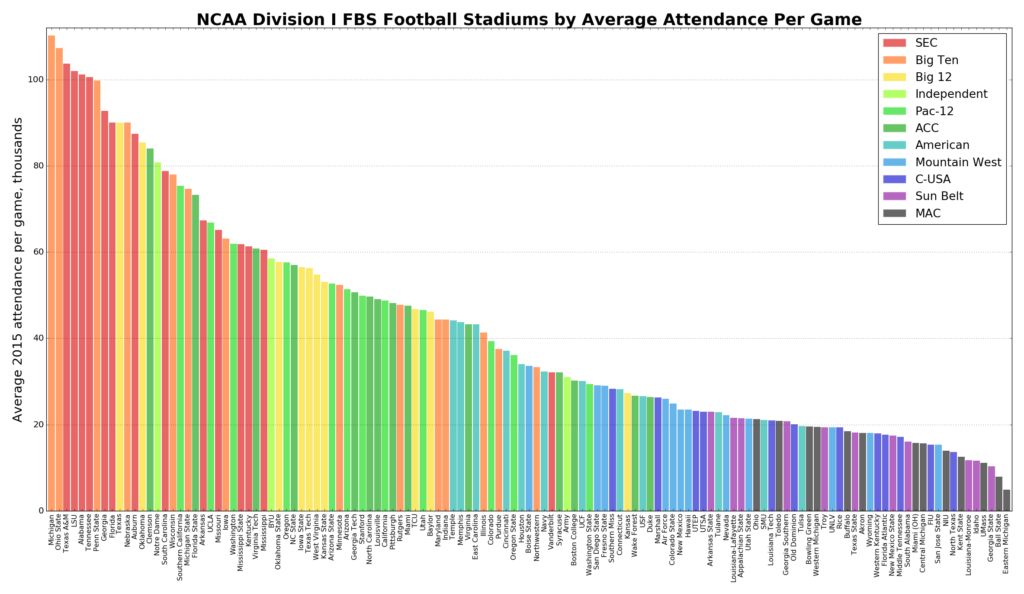
I received a few comments interested in further analysis of the actual attendance of games held in these stadiums. While capacity is interesting because it represents an expectation and sustained investment by the school, attendance represents the utilization of that investment. My stadium capacity data covered every NCAA division I football stadium in the U.S. as of the 2015 college football season. So, I downloaded the NCAA’s 2015 home game attendance data to compare. My data, code, and analysis are in this GitHub repo. First, I visualized the FBS attendance figures themselves:
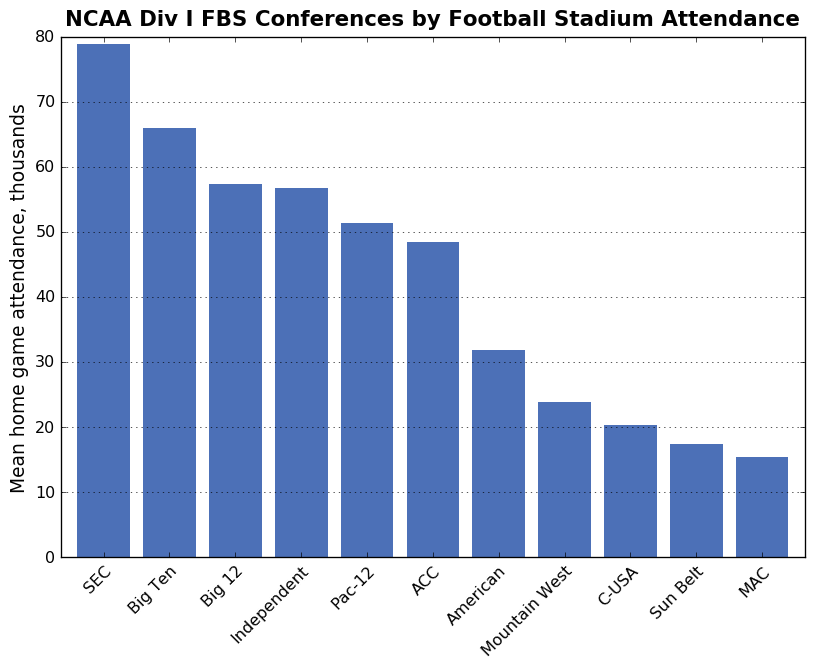
Michigan, Ohio State, and Texas A&M had the highest average attendance per home game in 2015. Overall, six teams exceeded an average of 100,000 people in attendance per game. The range of values ran from a high of 110,168 (Michigan) to a low of 4,897 (Eastern Michigan): the stadiums with the highest and lowest attendance are just 6 miles apart. I also grouped these stadiums by conference:
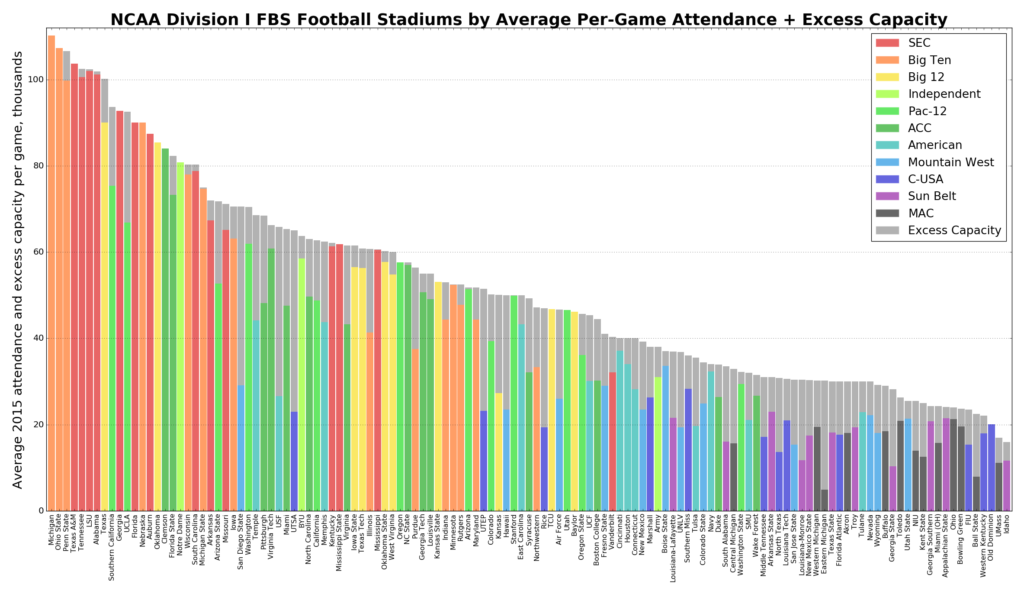
The SEC has the highest average home game attendance (79,000 people/game) and the MAC has the lowest (15,000 people/game). Next I looked at how this relates to stadium capacity. The colored bars below represent average attendance per home game, with excess stadium capacity in gray:
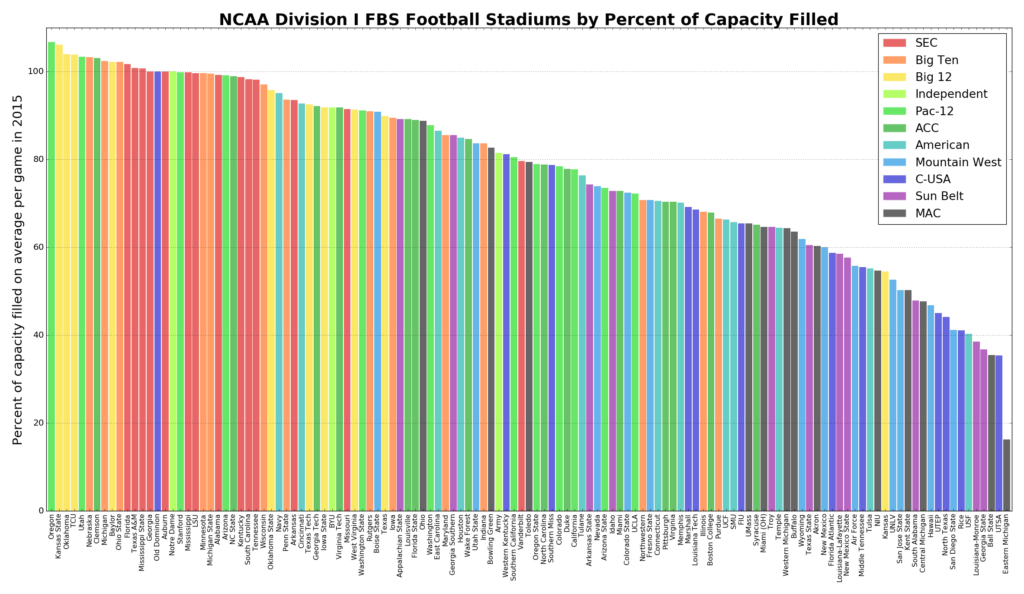
Teams like Michigan and Ohio State have enormous stadiums that fill up for all of their games. Other teams like USC and UCLA have very large stadiums but fill much smaller percentages of their capacity. Finally I looked at this another way – what is each stadium’s average attendance as a percentage of its seating capacity? In other words, what percent full does each stadium get, per-game, on average?
Oregon, Kansas State, and Oklahoma had the highest ratio of average attendance to stadium capacity in 2015. Overall, 17 teams averaged a sell-out crowd or better (e.g., from standing room only tickets exceeding the listed seating capacity). The range of values ran from a high of 106.7% of capacity filled (Oregon) to a low of 16.2% (Eastern Michigan). Also: 39 schools filled less than two-thirds of their stadium’s capacity on average, and 13 teams filled less than half.
I did this analysis in Python and my code is in this GitHub repo. For more on this, check out the earlier post in which I analyze stadium capacity and discuss the massive investments universities are now making in their athletic facilities.


One reply on “College Football Stadium Attendance”
[…] tracks attendance numbers vs. capacity, to track how full each team’s stadium actually is. As recently as 2015, Kentucky averaged just over 60,000 fans per game which put the Cats near 90% of stadium capacity. […]