Edward Lorenz, the father of chaos theory, once described chaos as “when the present determines the future, but the approximate present does not approximately determine the future.”
Lorenz first discovered chaos by accident while developing a simple mathematical model of atmospheric convection, using three ordinary differential equations. He found that nearly indistinguishable initial conditions could produce completely divergent outcomes, rendering weather prediction impossible beyond a time horizon of about a fortnight.
In 1963, Lorenz developed this simple model of the way air moves around in the atmosphere:

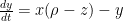

Now known as the Lorenz System, this model demonstrates chaos at certain parameter values and its attractor is fractal. The animation above depicts this system’s behavior over time in Python, using scipy to integrate the differential equations, matplotlib to draw the 3D plots, and pillow to create the animated GIF. All the code to re-create this is on GitHub in this repo.
In three dimensions, these trajectories never overlap and the system never lands on the same point twice, due to its fractal geometry. We can also look at this attractor in two dimensions with matplotlib:

For more about chaos, check out this blog post and this article. You can easily animate the Lorenz system and visualize its strange attractor with Python, using my code this GitHub repo. You might also be interested in Pynamical, a Python package for easily playing around with chaos, fractals, and strange attractors.
3 replies on “Animating the Lorenz Attractor with Python”
Does the Lorenz Attractor ever create a closed loop?
No, it will not form a closed loop as the system is chaotic, it will never return to the same position.
[…] (GIF: Geoff Boeing) […]